

by FTR | Sponsored Content, on Aug 07, 2023

From mid-2020 through mid-2022, the North American trucking industry saw an unprecedented period of entrepreneurship as drivers left larger carriers to set up shop on their own. Larger trucking companies are now welcoming that capacity back.
When we last addressed driver capacity, the data indicated a likely inflection. The February 2023 snapshot of Federal Motor Carrier Safety Administration (FMCSA) registration data showed a slight reduction in the driver workforce, but it was too soon to confirm a trend. Also, FMCSA registration data does not allow for precise estimates of carriers’ truck or driver capacity.
The June 2023 snapshot confirms that capacity is exiting the market but not uniformly so. The number of drivers working for small carriers has dropped sharply over the past year, but large carriers appear to have at least held on to their gains, which accelerated last year as small carriers began to fail.
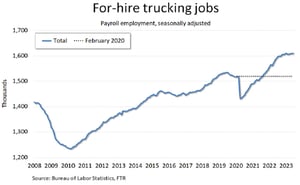
FMCSA data is not the only evidence of this resilience in capacity among larger carriers. The latest Bureau of Labor Statistics figures show payroll employment in for-hire trucking at essentially an all- time high despite the softness in the freight market.
 Driver capacity will likely continue falling due to a challenging climate, but so far the loss of active capacity appears more incremental than might have been expected. Meanwhile, near-term prospects for stronger freight demand appear remote, resulting in an extended period of weak capacity utilization.
Size Matters in the Current Market
We have used March 2020 as our baseline for analyzing capacity changes as it is the latest data available that did not include any significant pandemic distortion. We have not calculated for-hire capacity monthly but rather have taken occasional snapshots over time. Given that carriers are required to report only every two years on staggered schedules, monthly snapshots are unlikely to be especially revealing.
Our analysis suggests that active capacity in for-hire peaked in late third quarter or early fourth quarter of last year. The snapshots over the past year reveal trends that largely square with volume trends in the truck freight market.
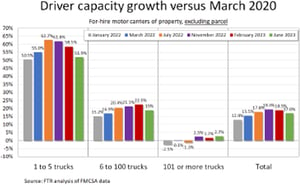
 FTR’s analysis of FMCSA registration data from June 2023 shows that total driver capacity at for-hire carriers (excluding parcel carriers) is down about 2 percentage points since February and just slightly more than that since November.
Capacity was still rising in July 2022, and the snapshots of capacity then and now are practically the same with a decline of just 13,500 drivers.
Overall for-hire active capacity has not changed much over the past year, but the experience differs greatly by fleet size. We noted in our February commentary that capacity gains by the small carriers peaked in the middle of 2022. Since February, driver capacity for this group has fallen sharply. Driver capacity in June was nearly 7 points below February and down nearly 10 points over the past year.
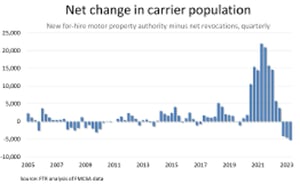
The decline in small carrier capacity is essentially a function of business failures, not downsizing. The past three quarters – the fourth quarter of last year and the first two quarters of this year – have seen the largest net declines in the for-hire trucking firm population on record.
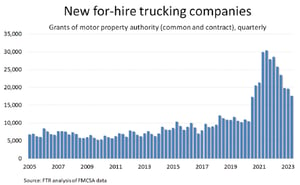
Net revocations of authority – revocations minus reinstatements – have soared while the number of new carriers has stabilized far below the levels seen in 2021. However, new entry is still running well ahead of pre-pandemic levels. We discuss below some likely factors in that resilience.
For carriers with more than 100 trucks, however, driver capacity is the highest it has been since before pandemic lockdowns, although it has not changed much since late 2022. As noted earlier and discussed more fully below, this trajectory squares with payroll employment figures.
Larger carriers have not been impervious to tougher market conditions, however. For example, 41 trucking companies with more than 100 trucks lost operating authority during the first six months of 2023 – just over twice as many as those that failed during the first six months of last year. About half of those that lost authority in the first six months of 2022 did so during May and June following the surge in diesel prices that was spurred by the war.
Larger carriers’ capacity might be holding up better than that for small carriers, but we cannot ignore the legacy of the pandemic on the trucking industry. Carriers with more than 100 trucks have just 2.7% more drivers than they did in March 2020 while carriers with 1 to 5 trucks still account for about 52% more drivers than they did before the pandemic.
The net carrier population likely will continue to fall at least until the truck freight market starts to tighten, but a full reversal of the two-year capacity shift toward small carriers is unlikely absent a major recession or other severe financial catastrophe.
Record Employment in Trucking
Payroll employment figures from BLS are a less precise measurement of driver capacity since they measure all employees and do not include carriers’ independent contractor drivers. The BLS figures also capture only workers who participate in the unemployment insurance program, which means that they generally exclude very small operations.
Still, BLS data is timelier than FMCSA data as it assesses the entire for-hire industry each month and is a useful directional indicator, especially for capacity in the contract arena, which is mostly the domain of larger carriers. Payroll employment figures reinforce the notion that larger truckload carriers have absorbed much of the capacity loss from the failure of small carriers. Seasonally adjusted, the all-time high for trucking jobs was in January of this year, but employment was only marginally – 1,700 jobs – lower in June.
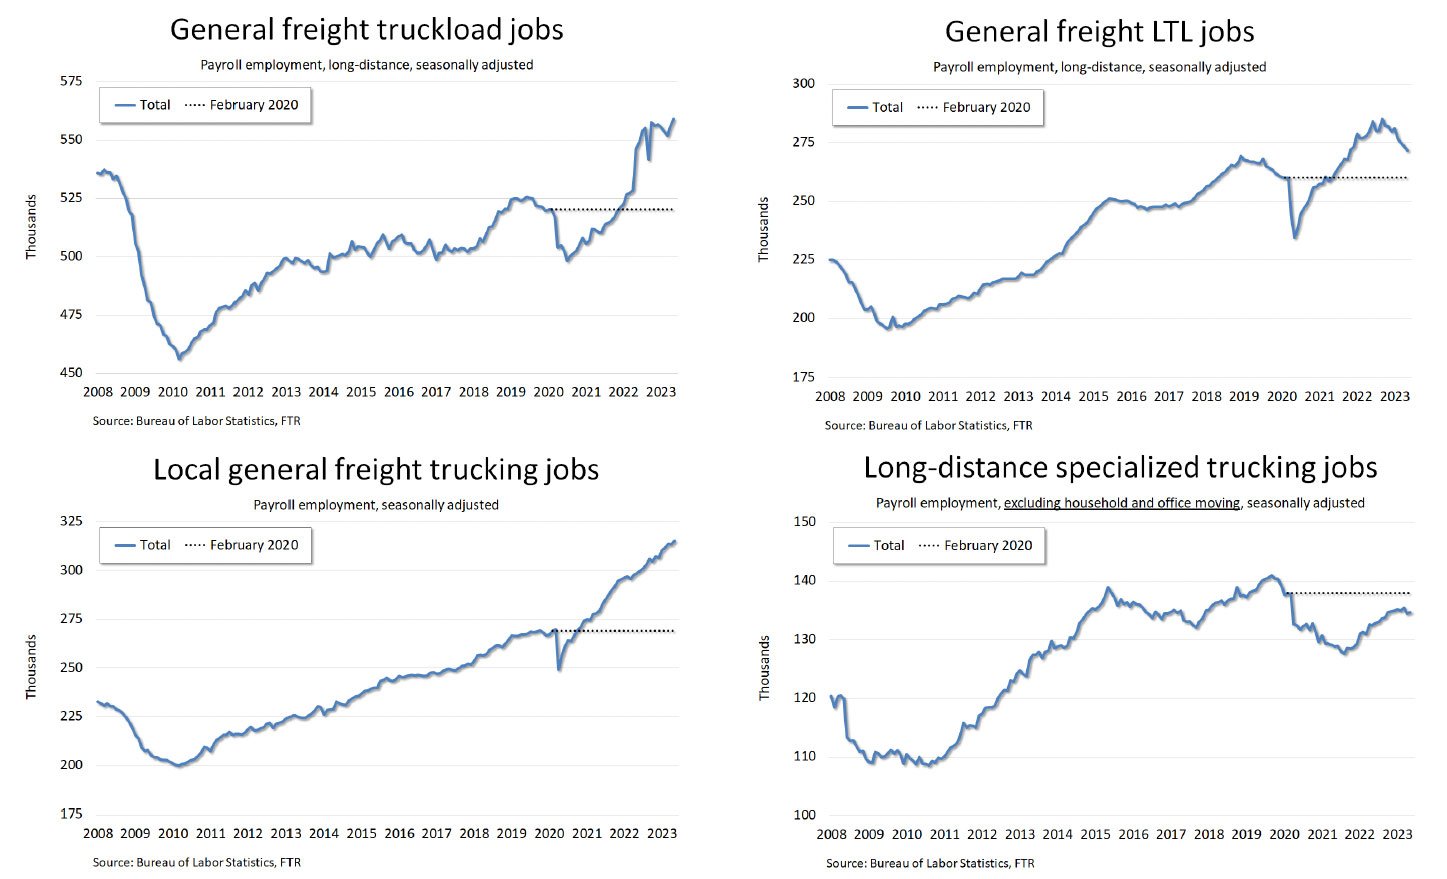
The industry’s employment strength is hardly uniform, however. Given the surge in final mile and wholesale deliveries during the pandemic, local general freight has, not surprisingly, seen the strongest growth. Employment in that sector in May – granular data lags by a month – was at an all-time high and was 46,300 jobs, or 17.2%, above February 2020, seasonally adjusted.
Perhaps more surprising is the strength in long- distance general freight truckload, which also was at an all-time high in May. Truckload job growth accelerated greatly in the second quarter of last year as smaller carriers started failing in large numbers, freeing up drivers. Despite a weak freight climate, truckload employment has been strong due to a shift of volume from spot to contract over the past 18 months. As of May, general freight truckload employment was 38,800 jobs, or 7.5%, above February 2020.
The employment arc in the less-than-truckload segment more closely resembles what one might expect. LTL payroll jobs peaked in September 2022 – around the time we estimate overall trucking capacity peaked – and has been falling steadily.
A major difference between truckload and LTL is that the latter, unlike truckload, does not have significant capacity among very small operations. Therefore, LTL carriers have not absorbed drivers displaced by failing small carriers the way larger truckload carriers have.
Although LTL employment has been falling for about nine months, it is still slightly higher than the pre-pandemic peak in December 2018. LTL payroll jobs are 11,700, or 4.5%, above February 2020.
Long-distance specialized (excluding household and office moving) is the one major trucking segment where payroll employment still trails the pre-pandemic level. That segment is 3,300 jobs, or 2.4%, below February 2020.
Although the specialized segments certainly struggled more than general freight did during the pandemic, the capacity shift to small carriers likely is a factor in long-distance specialized not fully recovering. Spot rates for flatbed equipment have held up better than rates for dry van and refrigerated, so those small carriers probably have fared better over the past 18 months or so.
Why is New Entry Still Relatively Strong?
The net decrease in the carrier population has set a record in three straight quarters, but those numbers would have been even larger had the number of newly authorized carriers fallen back to at least the pre-pandemic norm.
New entry has fallen sharply since peaking at more than 30,000 new carriers in the third quarter of 2021. However, the nearly 18,000 new carriers authorized in 2023Q2 is still 64% higher than the quarterly average in 2018-2019, which was the strongest two- year period on record before the pandemic.
Technology certainly is a major factor. Digital freight management platforms have allowed intermediaries to manage capacity from the numerous very small carriers more effectively.
Another contributor is California’s AB 5 law, which outlaws use of the leased owner-operator model and, thus, encourages such operations to establish firms under their own authority. The percentage of new carriers that are based in California jumped sharply a year ago after the U.S. Supreme Court cleared the state to enforce AB 5 on motor carriers.
The rise of power-only options probably has bolstered new entry as well. FTR’s analysis of FMCSA data suggests that the percentage of tractor operations that begin operation without a trailer has risen from about 30% in mid-2019 to around 45% today. Power-only operations reduce carriers’ equipment and maintenance costs.
Also, while spot rates for van equipment have been weak, they have been stable, and diesel prices have been mostly falling for more than a year. Fuel prices seem to be firming up, however, and that change could trigger a reduction in new entry. More small carriers surely will fail, but it is not so certain that larger carriers will continue to absorb that capacity.
Notes on the Data
This commentary is based mostly on FTR’s analysis of data that interstate motor carriers submit periodically to the Federal Motor Carrier Safety Administration. We exclude from our analysis for-hire carriers that did not hold operating authority during the periods assessed. We also exclude private fleets that also hold authority as we do not believe they provide reliable for-hire capacity.
Interstate for-hire and private carriers must update their profile data once every two years, and they do so on a staggered schedule. Therefore, we cannot estimate capacity precisely at any given point in time, but by revisiting the data over time we can build a more reliable view.
Many carriers update their data more often than every two years, but FMCSA registration data is sluggish in that it generally will not capture changes as quickly as they happen. However, there is an exception, and it has proven to be important during the pandemic surge in the number of newly authorized trucking companies.
When a new carrier is added to the market, its data is im- mediately captured. Therefore, while data on existing carriers might be directionally correct but off by scope, data on new carriers is much more timely.
FMCSA’s Motor Carrier Management Information System (MCMIS) also includes data on intrastate motor carriers that hold US DOT numbers. However, those carriers are not re- quired to update their demographic data after their initial submissions and most do not. FTR, therefore, considers intrastate data to be unreliable.
FTR’s analysis of net changes in the carrier population is based on a separate FMCSA dataset that tracks carrier licensing and insurance. FTR uses this data to calculate the number of newly authorized property carriers – i.e., trucking companies – and the number of net revocations of authority. Net revocations are the total number of revocations in a given period minus the number of reinstatements of authority in the same period. The net change in the carrier population is the number of new carriers in a period minus the number of net revocations in that same period.
Is a lack of actionable insights in your market intelligence processes leaving money on the table for your organization?
Find out how FTR can help you with the monthly Shippers Update subscription service. Learn more at freight.ftrintel.com/shippersupdate-fsa.

Like this kind of content? Subscribe to our "Food For Thought" eNewsletter!

Now more than ever, professionals consume info on the go. Distributed twice monthly, our "Food For Thought" e-newsletter allows readers to stay informed about timely and relevant industry topics and FSA news whether they're in the office or on the road. Topics range from capacity, rates and supply chain disruption to multimodal transportation strategy, leveraging technology, and talent management and retention. Learn More
