

by Loadsmart | Sponsored Content, on May 08, 2023

In this report, you’ll find trucking-related economic data and analysis, based on the previous quarter, that will provide a macroeconomic view on the state of the market with insights into how to prepare for the upcoming quarter. For each month you will find key factors that had an impact on our trucking economy, as well as volume and rate data for the most recent month.
Key Takeaways from Q1:
- A slowdown in manufacturing suggested further declines in freight volumes.
Industrial production has been declining since September 2022, potentially due to weaker consumer demand. - The gap between the Contract & Spot spread continued to narrow in 2023, but this trend has slowed due to further Spot rate declines.
Shippers took advantage of the excess capacity, pushing contract rates down to follow spot levels. Carriers, in turn, continue to accept lower rates in an effort to maintain volumes. - March marked the beginning of an unprecedented banking crisis.
Credit-driven consumption may slow down in the coming months, potentially impacting the full truckload market with reduced volumes.
Loadsmart’s 2023 Truckload Market Outlook:
As noted in previous updates, our spot market forecast predicted a Q4’23 spot rate rebound which would put Q4’23 around 10-15% up from today’s lows (+0-5% YoY). We’re currently refreshing this forecast with some more bearish assumptions that will likely push this rebound back to Q1’24 - why:
- Demand indicators and the overall economic backdrop have worsened slightly. Most notably, Industrial Production for Q1’23 is likely to turn deflationary (YoY) for the first time in 3+ years and we expect consumption to remain flat or even decline amidst the continued high-interest rate environment.
- The reduction in capacity is continuing to take longer than expected and we expect nothing different over the coming months due to:
- Excess carrier profits stemming from the historic bull market
- Lower diesel rates YTD’23 (though this may reverse),
- Simply the vast amount of excess trucks in the market today (we estimate 250k+)
- Contract rates are now down -15% YoY and we expect this number to get to -20-25% over the next two quarters based on our internal RFP pricing data (and as we all know contract inevitably follows spot)
A Look Ahead Into How Your Sector May Look Moving Forward
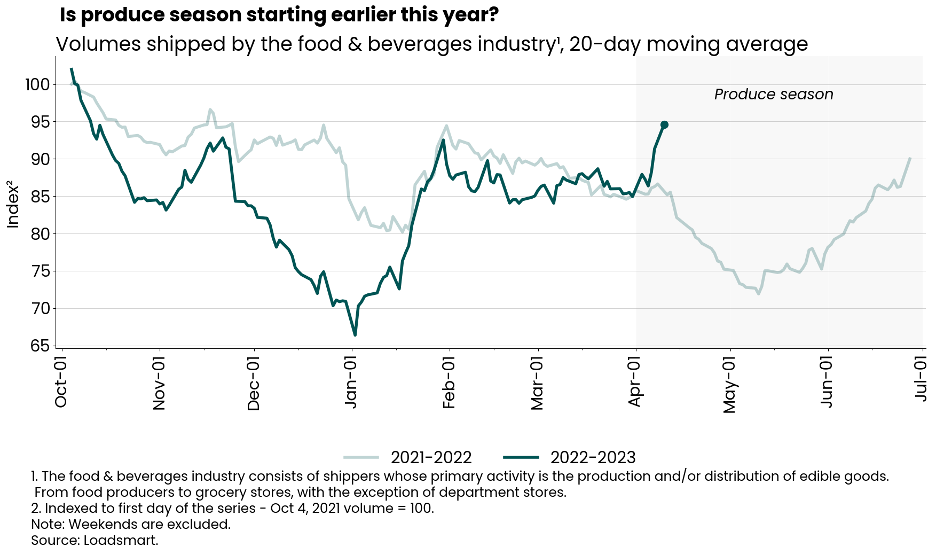
Food & Beverage: Volumes for Food & Bev have been in a shallow downtrend since February 2023. Based on last year, we expect food & beverage volumes to rise over the next 1-2 months as it seems that produce season impact has likely already begun.
- As depicted by the lighter line in the chart above, produce season’s impact seemed to clearly take hold beginning May 2022. Each year produce season’s impact hits the market at different times, and based on our indices current trends, we think produce season could already be in action.
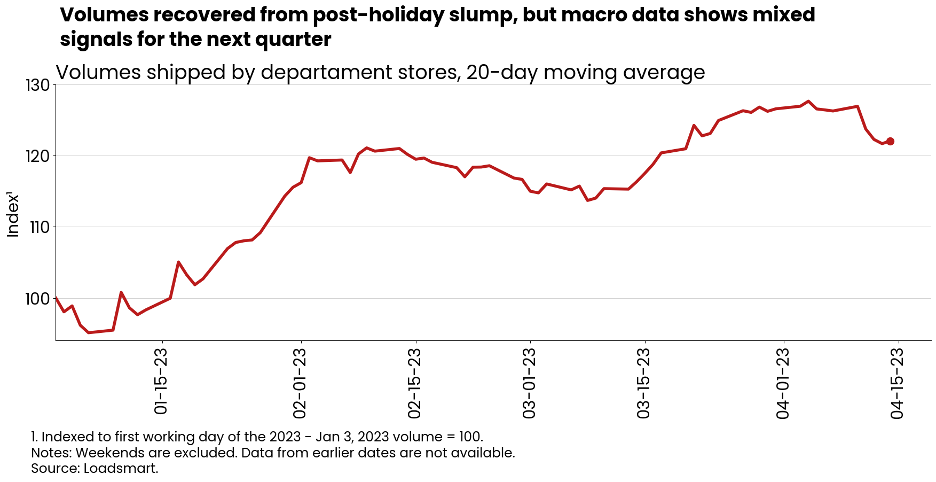
Department stores: The first quarter of 2023 was marked by a drop in department stores’ volumes, likely driven by their usual post-holiday slump in their sales. Over the next quarter, we expect this index to remain flat.
- The inflationary environment is not favorable for department stores, but we cannot anticipate to what extent large department store groups will be willing to cut margins to maintain volumes in this bearish scenario.
- The upside of 2023 is that they are better managing stocks amid slowing demand because inventory metrics have improved compared to last year’s - February’s inventory-to-sales ratio is down 6% YoY. [Inventory-to-sales data is available here]
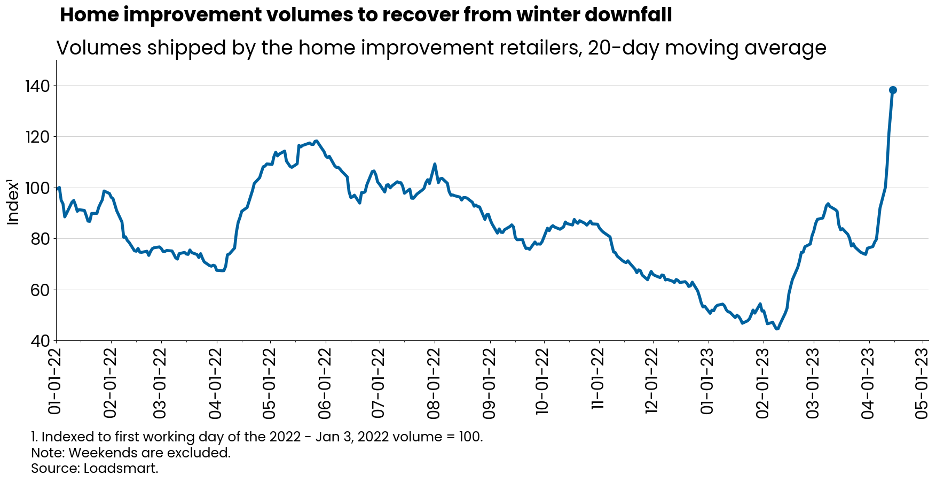
Home improvements: home improvement retailer shipments regained momentum in March, in line with the increase in furniture and home furnishings store sales on the month - real retail sales in the sector rose 13% MoM, after consecutive declines since December, according to these data points adjusted for CPI. We expect volumes in this sector to continue to recover as residential remodeling picks up from winter to spring.
- Also, even with the projected home price depreciation for 2023, the demand for home improvements will likely keep its steam assuming there are no major shocks to the housing market or to personal disposable income. Mean Sales Price of Existing Homes are found here.
A Deeper Dive Into How Each Month Played Out for the Freight Market..
January 2023
Prices peaked in the first week of the month - likely still boosted by the holiday season’s tightened capacity; then they fell back to December 2022’s floor.
Retailers Inventory-to-Sales
The second half of 2022 was marked by a shrinkage in inventory levels as stores bore down their efforts to clear up inventory amidst recession fears - stemming from worries that high inflation and credit card delinquency rates rising may dampen personal consumption in 2023.
But, despite retailers' efforts to bring down inventories and lower the inventory-to-sales ratio, the ratio has remained consistently high since August - Figure 4. The ratio is not expected to get back to its pre-pandemic levels because supply-chain management developments are making retailers more capable of quickly adjusting the mismatches between demand and inventory availability, without the need of piling up excessive inventory.
We predict another increase in inventory to sales metrics as the Advance Retail Sales Survey reported a decline in sales for December - which suggests that holiday deals were not enough to foment a shopping spree large enough to take significant inventory off the shelves.
Industrial Production
Industrial production slumped 1.5% MoM in December ‘22. The index has been declining since September, potentially due to weaker consumer demand. As expected, the fall in production was more pronounced for cyclical sectors, which are more likely to have their consumption postponed during recessions: durable goods output fell 3% since October, while non-energy, nondurable goods production fell 1% - see the figure below.
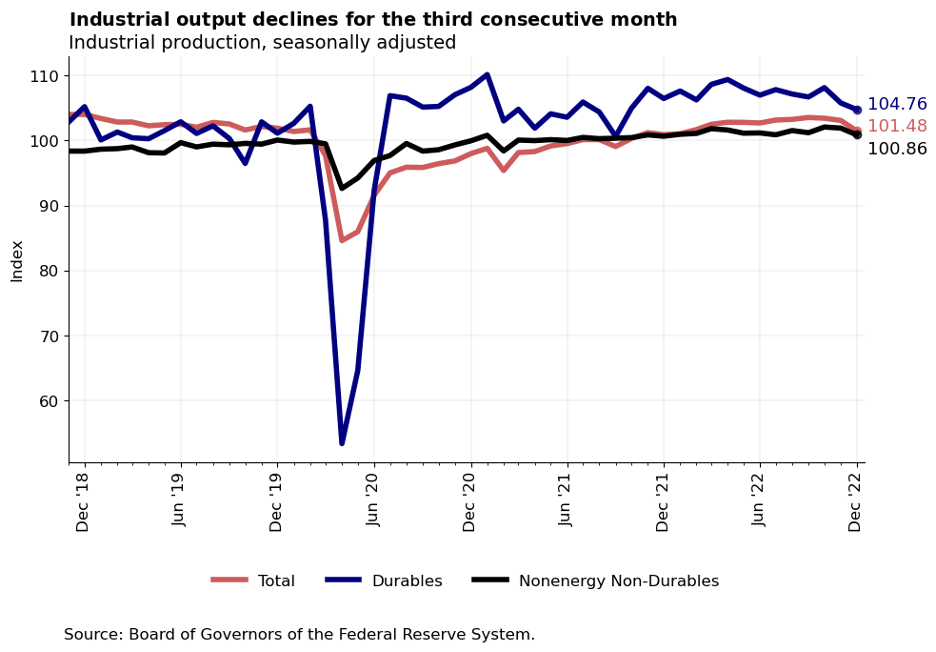
For the truckload market, the slowdown in manufacturing suggests further declines in freight volumes in the near term.
February 2023
By mid-February, our rate index had reached its lowest point in the current deflationary market cycle, but then slowly regained steam in the last week.
Contract to Spot Spreads
As we predicted at the end of last year, the spread between contract and spot rates started the year on a downward trajectory. The reasoning behind our forecast was that shippers would take advantage of the soft freight demand & excess capacity, pushing contract rates down to follow spot levels; carriers, in turn, would keep an effort to maintain minimum contracted volumes in the 1H2023 bidding season.
In 2023 we have seen this trend take place: from July 2022 to January 2023, Loadsmart's average monthly spread dropped 10 p.p., from 20% to 9% - shown below. However, the additional spot rate contraction that began in February slightly reversed this trend - the current spread, updated on the 14th of April, is 13%.
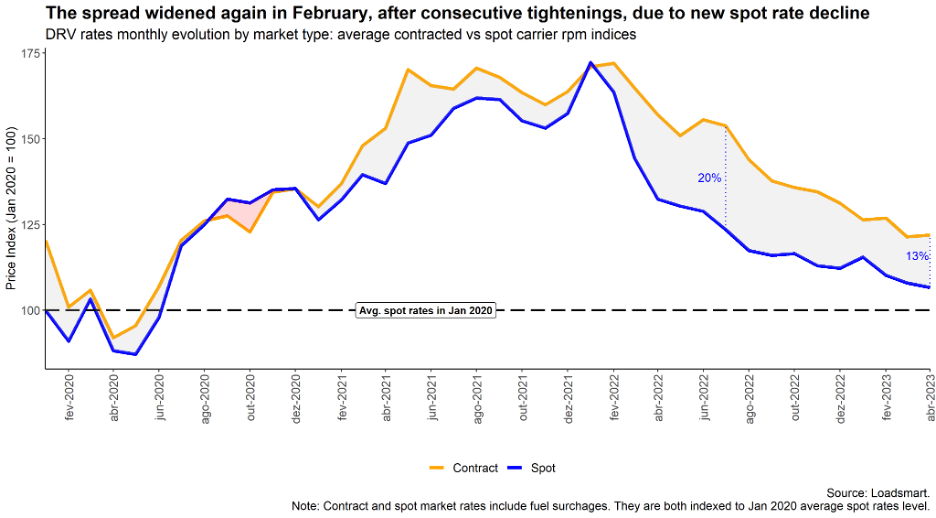
In February, our spot price reached a new floor, while the contract price remained stable at a level similar to January, leading to a widening of the spread. Sonar metrics showed a similar pattern, suggesting that the spot prices slide was widespread in the market. Sonar and Loadsmart’s metrics followed similar trends through time, although Loarsmart’s spreads have reached lower levels since the beginning of 2H2022.
Heavy Truck Sales
Another impact on the freight economy, heavy truck sales are down to 450 thousand units in February, a 12% decline MoM. The biggest monthly decline in sales in over three years - shown below.
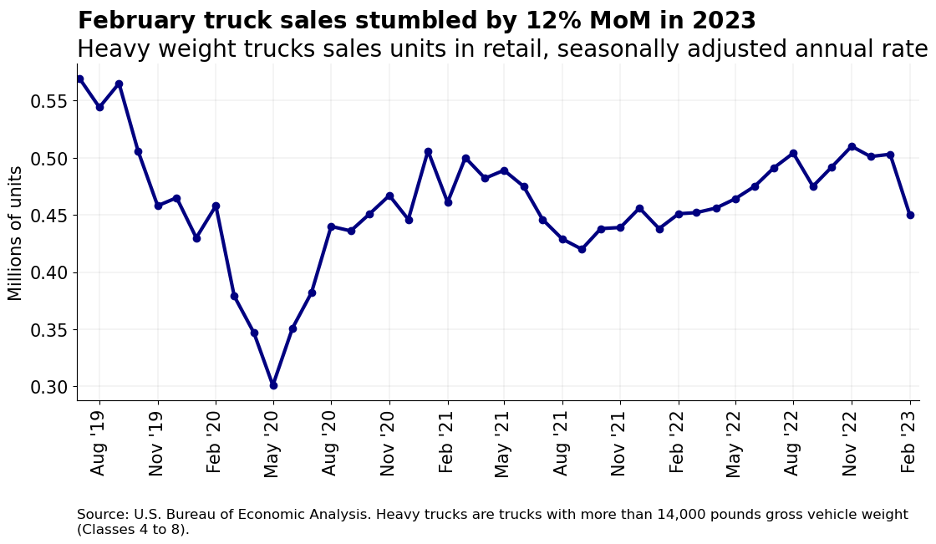
Despite the recessive freight market during 2022, truck sales continued to rise throughout the year, likely due to the shortage of trucks in inventory during the pandemic period. However, recent data suggest that the late truck replacement cycle that supported the market last year is now over. In addition to the recessionary scenario for trucking, vehicle financing conditions worsened due to consecutive interest rate hikes.
March 2023
Our spot rate index fell by 20% MoM, returning to February’s low by the end of the month. Our volume index rose for the fifth consecutive month in March.
Full Truckload Market Update:
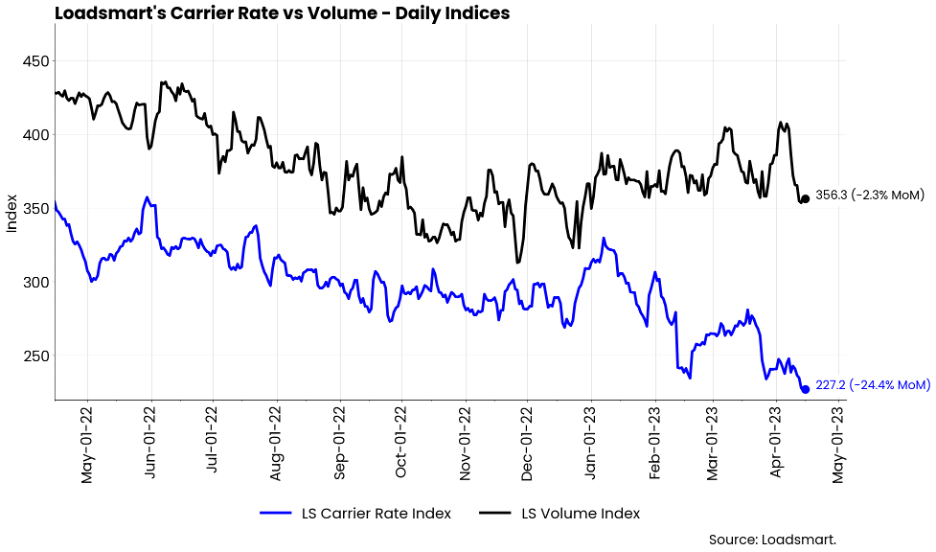
Volumes: Our volume index increased by 3.5% in March (from day 01 to 31). The index was rather stable during the month. We continue to emphasize the positive recovery of our volume index, our index rose for the fifth consecutive time in March on the monthly average and is only 5.2% down YoY. If this trend continues, our 2023 produce season should be busier than in the previous year.
Rates: Our price index fell by 19.7% MoM. From February 19th to March 24th, prices were on a steady recovery path, moving away from the February low. But by the end of the month, prices had plunged back to the same low point from February. This plunge was widespread across regions and was surprising given the timing with EOQ. We expect prices to remain low during March and early April during the transition from winter to spring until the demand for produce season picks up.
Credit Constraints to Weigh on Consumer Spending
March marked the beginning of an unprecedented banking crisis that may weigh on consumer spending in the coming months. The failure of three US banks - Silvergate, Silicon Valley, and Signature - plus Credit Suisse has raised fears of a liquidity crunch in the financial system.
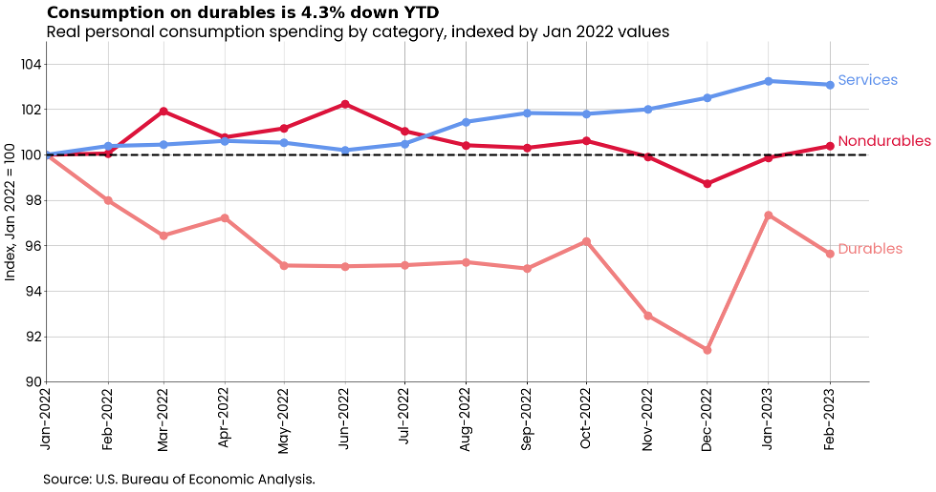
This directly impacts banks' lending activity, so consumers can expect to see a deterioration in personal credit conditions in the months ahead. Real consumption spending is down by 0.2% MoM, but up 1.5% YTD. As shown in the figure below, only the service sector has kept steady growth since January 2022; while nondurables spending is stagnant, and durables spending plummeted in 2022. In January 2023, durables spending rebounded due to auto sales but decreased again in February.
OPEC+ Production Cut impact on Diesel Prices
On April 2nd, Opec announced a production cut that will begin in May and run until the end of 2023. The cut came as a surprise to the US administration, which has been trying to lower fuel prices in order to control domestic inflation and ease the dependence on OPEC+ decisions. The US government has been controlling the oil supply in its territory through the use of the Strategic Petroleum Reserve (SPR). However, the SPR may not be able to offset the effect of this unexpected production cut by OPEC+ members because it is unable to increase its oil production in the short term.
It is still unclear how much of the OPEC+ decision will be passed on to retail diesel prices, but we expect an upward revision to the price forecasts from the latest EIA report - shown below.
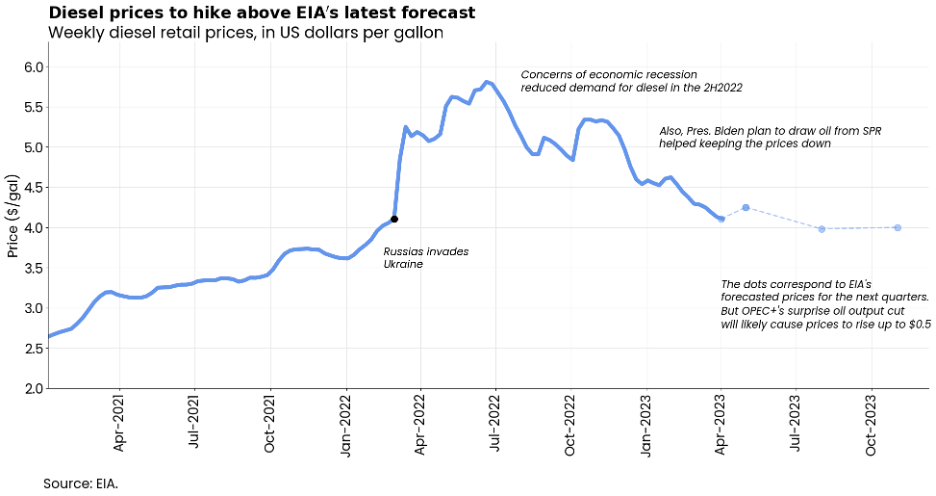
Fuel prices were already projected to increase slightly over the summer, and the OPEC announcement will contribute further. However, the effect should be small and it is unlikely that prices will reach 2022 levels and exceed $5 per gal.
Like this kind of content? Subscribe to our "Food For Thought" eNewsletter!

Now more than ever, professionals consume info on the go. Distributed twice monthly, our "Food For Thought" e-newsletter allows readers to stay informed about timely and relevant industry topics and FSA news whether they're in the office or on the road. Topics range from capacity, rates and supply chain disruption to multimodal transportation strategy, leveraging technology, and talent management and retention. Learn More
