Quarterly Freight Data Report: A Q2 Review of the Trucking Economy & How It Will shape Our Thinking for Q3
by Loadsmart | Sponsored Content, on Jul 24, 2023 10:18:28 AM
In this report, you’ll find trucking-related economic data and analysis, based on the previous quarter, that will provide a macroeconomic view on the state of the market with insights into how to prepare for the upcoming quarter. For each month you will find key factors that had an impact on our trucking economy, as well as volume and rate data for the most recent month.
Key Takeaways from Q2:
- Flatbed rates are on an upward trajectory.
Loadsmart’s flatbed index started recovering in November ‘22 and is currently up 25% from the ‘22 bottom. - Ocean freight is looking at a modest peak season.
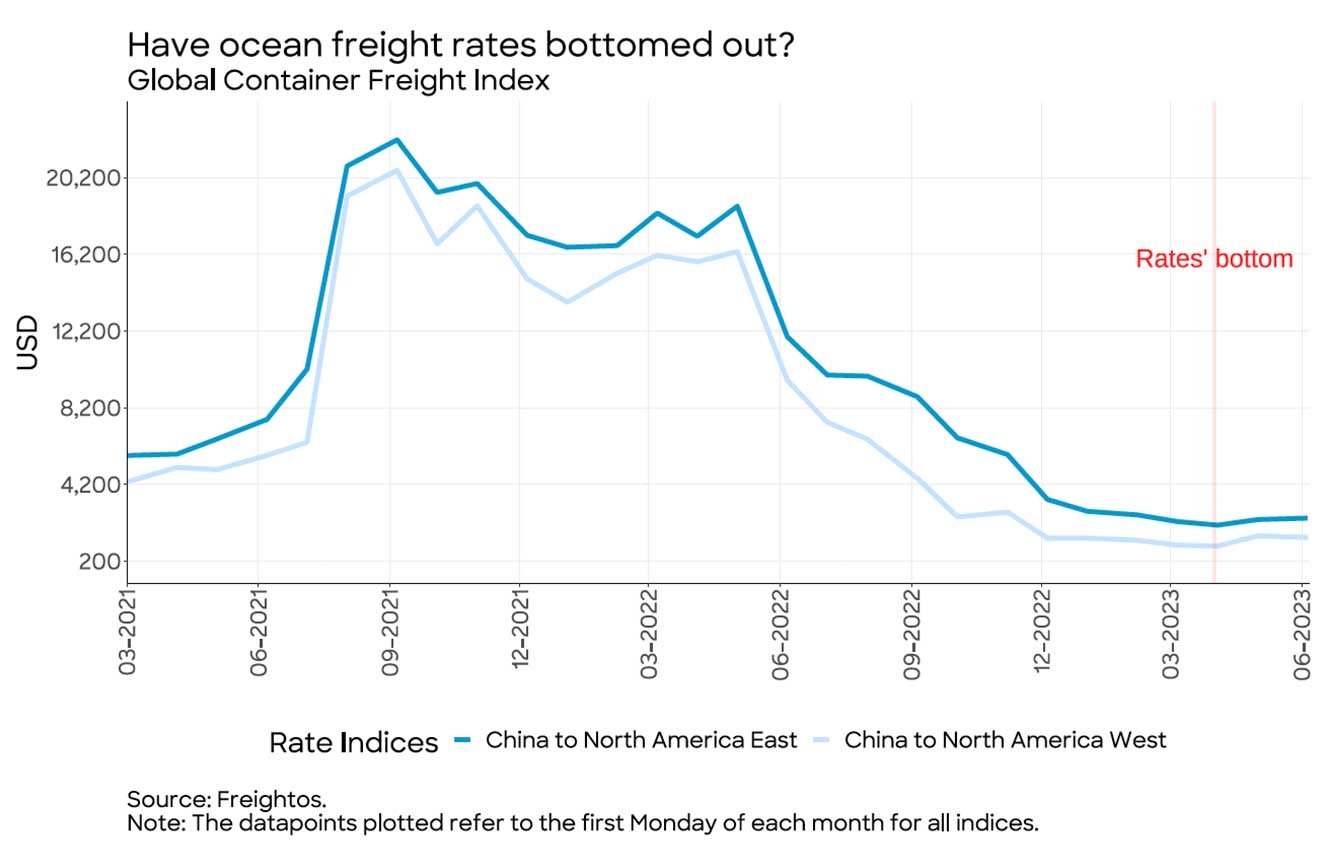
As ocean freight rates have bottomed out and stabilized over the past two months, we expect to have traditional peak season back, but probably a modest one. - Consumers’ recession fears are fading. A rise in the Conference Board’s Consumer Confidence Index reflects consumers’ optimism about current macroeconomic conditions.
Loadsmart’s 2023 Truckload Market Outlook:
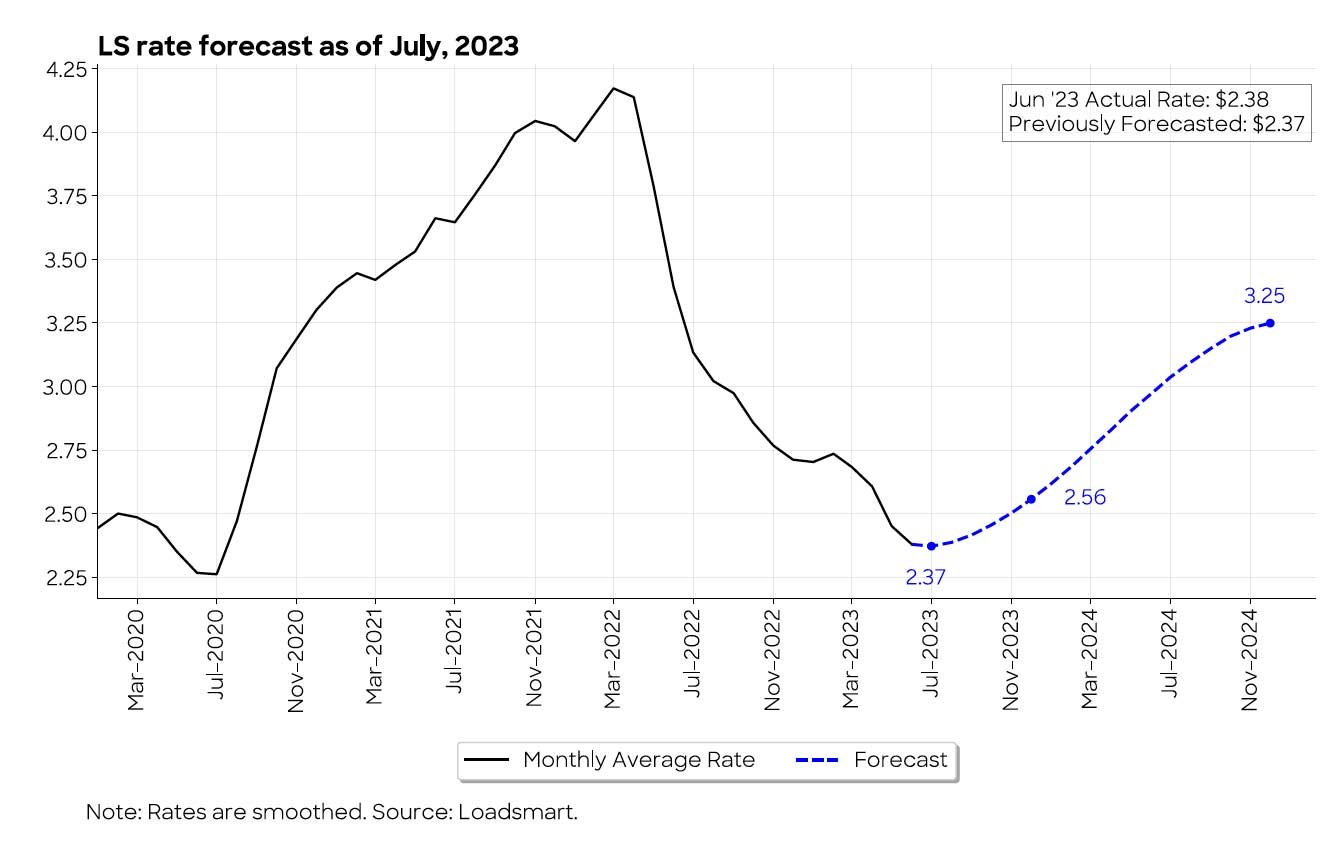
Using Loadsmart’s new long-term spot rate forecast - shown in the image above - derived from our
predictive model that combines internal data with key macroeconomic indicators, we’ve generated our latest look-ahead below:
As of July 1, 2023, our model predicts that the monthly average spot price should finally bottom out in July, falling from the June average of $2.38 to $2.37 in July only.
Given the current economic outlook of declining consumption and industrial production, the model forecasts a mild recovery starting in August. This turnaround will be largely driven by the fact that capacity loosening has reached its limit, i.e. enough carriers have exited the market to rebalance supply & demand, as a result of extremely low spot & contract rates and lower overall freight volume.
By the end of 2023, our forecast predicts that rates will rise to $2.56 (a 9% increase from July’s forecasted bottom) and continue on an upward trajectory through 2024.
An Inside Look Into Your Industry: Food & Beverage
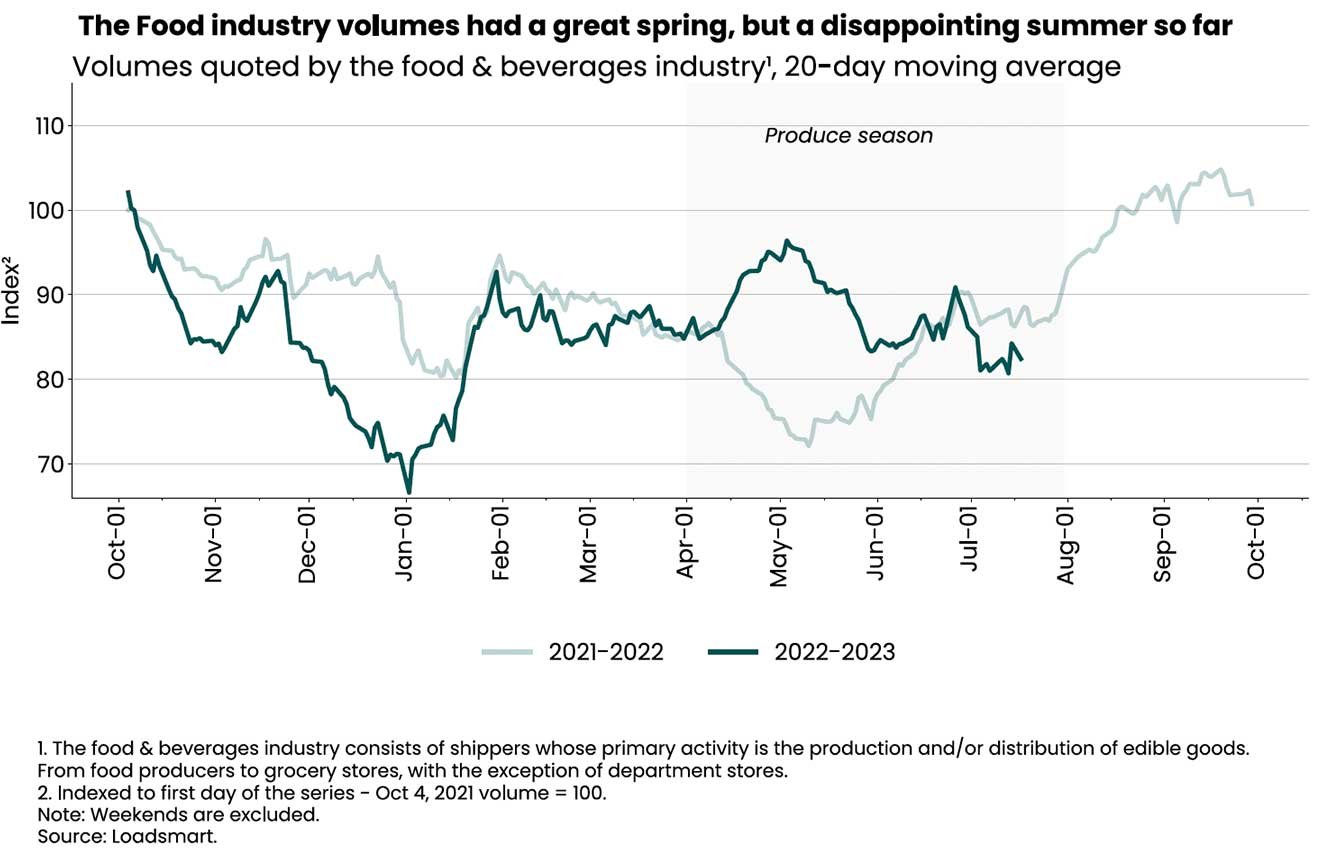
Quoted volumes associated with the Food & Beverage sector peaked in May, then returned to April levels and remained steady. These results were below our expectations. The sector had a great spring but a disappointing start to summer, up only 2% QoQ.
Our reefer quoted volumes for Food & Bev were down 3.5% in Q2 ’23, compared to the same period last year. Dry van, on the other hand, we had a rise of 20% in Q2 ’23, compared to the same period last year.
Last year’s production season took a long time to ramp up, but once it did, demand remained strong through the end of spring. For the time being, we do not expect to see any major fluctuations in volume until the end of the summer, as we did not see much volatility in quotes due to the 4th of July holiday.
An Inside Look Into Your Industry: Retail
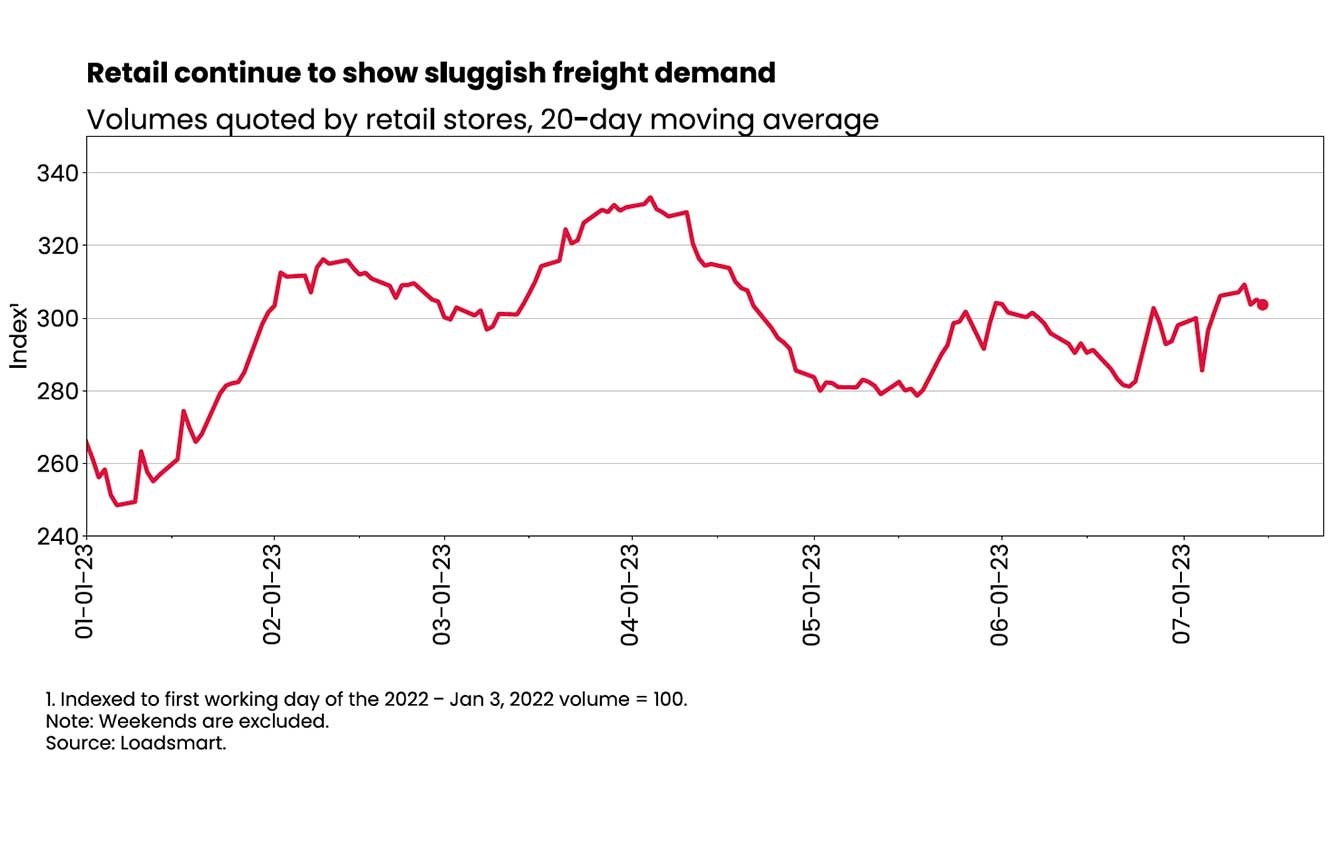 Quoted volumes for the Retail sector are down 4% QoQ. The decline in freight demand is in line with the decline in sales volumes in this sector.
Despite the belief that large retailers would drive freight demand up in Q2 ‘23, given their seasonal inventory restocking needs, there has not been much change in the sector yet. We expect the sector’s freight demand to pick up only by October, the typical restocking month for stores.
Ocean Freight May Be Heading Into A Modest Peak Season This Year
Before the Covid-19 supply chain disruption hit the freight industry, ocean shipping typically had a peak season from July through September. As ocean freight rates have bottomed out and stabilized over the past two months, we expect to have this traditional peak back - albeit it will probably be amodest one.
As shown in the figure below, the US’s most relevant routes reached a floor in April 2023. In that month, rates for containers coming from China to the West Coast and China to the East Coast were around $990 and $2,085, respectively. After that, they both had slight rises and are currently at $1,440 and $2,451.
Now that prices have normalized to levels below the pre-covid period, carriers are ready to test new rate increases as soon as there is a seasonal rise in demand to justify it.
Full Truckload Market Update
Volumes: Our volume index decreased by 4.9% MoM in June. In the first two weeks of June, the index rebounded slightly from its mid-May lows but then it plummeted due to the Juneteenth holiday. After Juneteenth, volumes inched up again.
In our view, the recent holidays have made our volume data noisy and not very useful for long-term analysis. However, the fact that prices responded so massively to the increase in demand for the 4th of July this year, unlike last year, may indicate that capacity is not as abundant as it once was.
Rates: Our price index increased by 16.5% MoM in June. The index has been on a rather erratic path due to the holidays: prices have had a temporary drop associated with the Juneteenth holiday and a late spike associated with the 4th of July holiday.
These price fluctuations were greater in the Southwest, West, and Northeast regions, while in other areas they remained stable throughout the month. We expect this index to revert back down at least 5-10% as we progress in July, but it should remain above the June lows
Consumers’ Recession Fears Are Fading
The Conference Board’s Consumer Confidence Index rose back to levels seen in early 2022 when consumption was still growing above 5% year-over-year. The index jumped from 102.5 to 109.7 from May to June, as seen in the figure below.
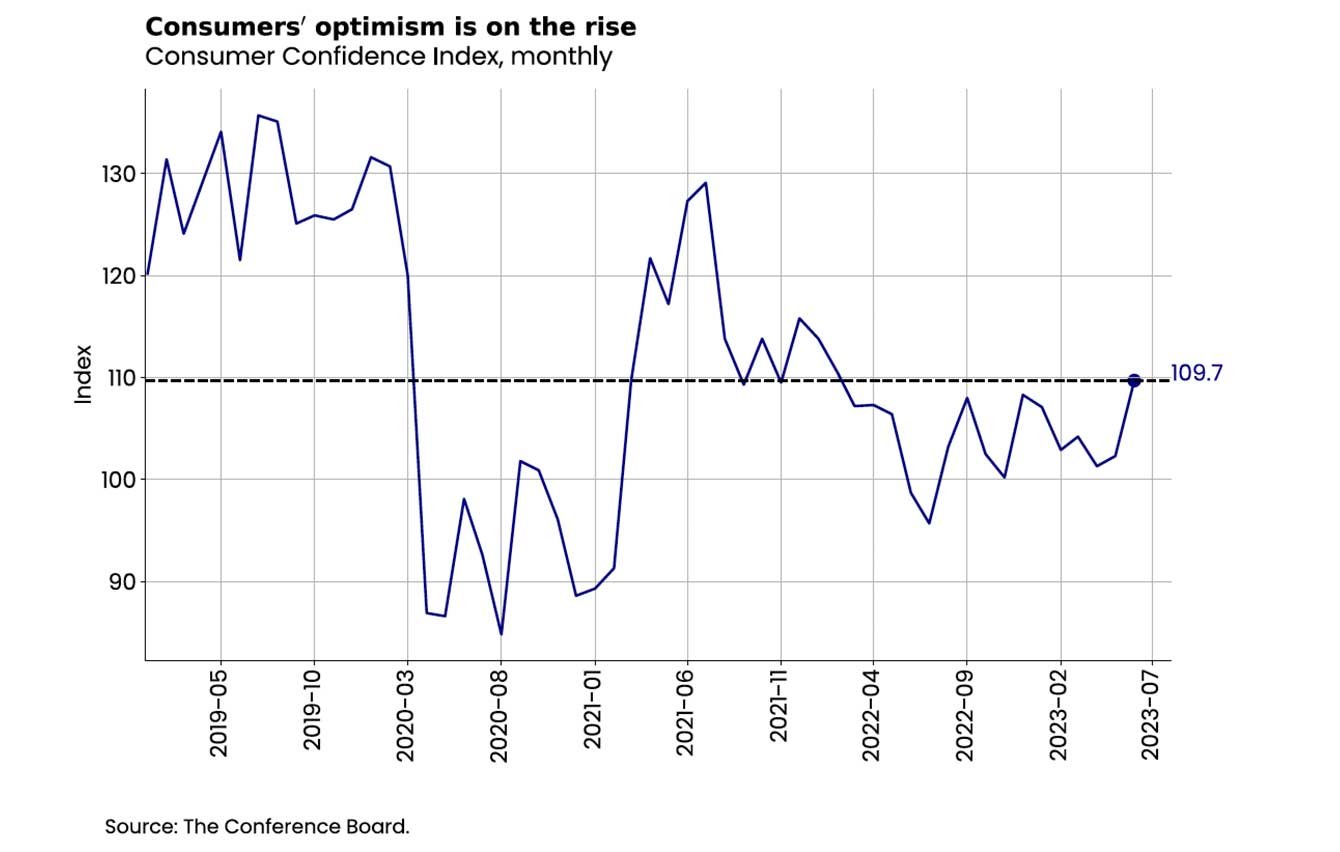
The rise in the index reflects consumers’ optimism about current macroeconomic conditions (the labor market, business conditions, and household income), which might be stemming from recent positive news: inflation is easing, the labor market remains strong and the debt ceiling crisis is over.
Consumption data for the months of May and June are not yet available to indicate whether the improvement in the index has translated into a real increase in spending. However, in the current context of economic uncertainty, the rebound in consumer confidence suggests the odds of a soft landing have been raised, at least from consumers’ perspective.
Factory Orders Are Showing Strength, Although It’s Limited to a Few Sectors
May’s industrial activity results show signs of resilience. Real consumer durables orders rose 3.4%. MoM - shown below.
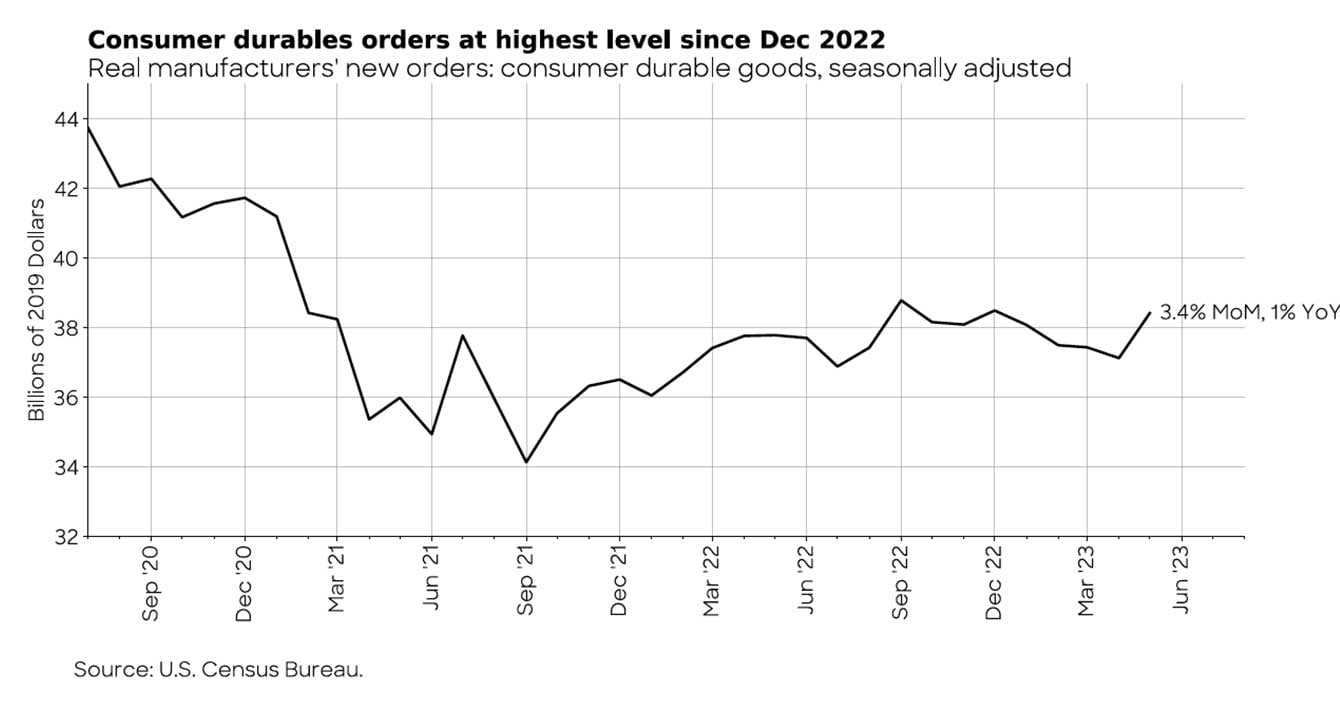
This strength in the factory orders data is mainly driven by motor vehicles, the only sector that has seen consistent order growth throughout the year. The auto industry is one of the few that is still suffering from the effects of pent-up demand due to production shortages during the pandemic.
 Download the Quarterly Freight Data Report: Q2 2023
The Quarterly Freight Data Report: A Q2 Review of the Trucking Economy & How It Will Shape Q3 '23 is a publication using Loadsmart data sets for shippers. Understanding the cyclical nature of the market, and where we currently are within that market, helps Shippers to make better predictions for the current quarter and into the new year. Download Now
Like this kind of content? Subscribe to our "Food For Thought" eNewsletter!
Now more than ever, professionals consume info on the go. Distributed twice monthly, our "Food For Thought" e-newsletter allows readers to stay informed about timely and relevant industry topics and FSA news whether they're in the office or on the road. Topics range from capacity, rates and supply chain disruption to multimodal transportation strategy, leveraging technology, and talent management and retention. Learn More


