

by Loadsmart | Sponsored Content, on Oct 29, 2023
The trucking industry is cyclical. This means that in logistics you can count on history to repeat itself. That makes understanding where the market has been essential to predicting where the market is going.
In this report, you’ll find trucking-related economic data and analysis, based on the previous quarter, that will provide a macroeconomic view on the state of the market with insights into how to prepare for the upcoming quarter. For each month you will find key factors that had an impact on our trucking economy, as well as volume and rate data for the most recent month.
Key Take-Aways from Q3:
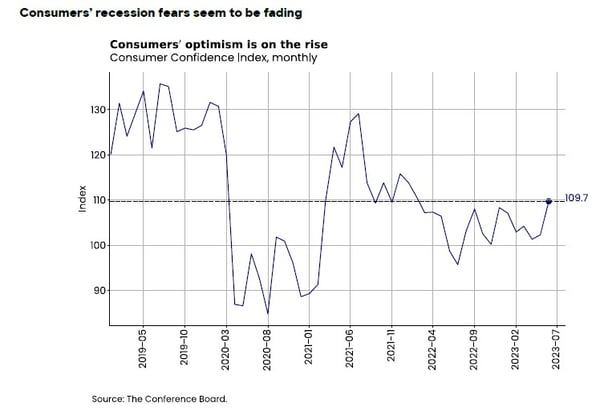
We saw a rise in the Conference Board’s Consumer Confidence Index. The rebound in consumer confidence suggests the odds of a soft landing have been raised, at least from consumers’ perspective.
Transportation & Warehousing was the worst performing sector among the service sectors. Transportation and warehousing had the largest revenue decline among all services sectors in 1Q2023, with its real revenue falling 7.8% QoQ.
Hiring announcements have been mostly muted this year compared to previous years. This highlights retailers’uncertainty about the state of the economy over the next few months.
Loadsmart’s 2023 Truckload Market Outlook:
As of October 2023, our model predicted that rates would rise from $2.37 to $2.44 in September. Our prediction was right on the nose. By the end of 2023, our forecast calls for prices to rise to $2.6 and continue upward through 2024.
Since June, when we began publishing Loadsmart’s long-term spot rate forecasts, we have adjusted our December 2023 (from $2.56 to $2.6) and December 2024 (from $3.28 to $3.41) predictions due to the mid-year spike in rates, which exceeded our expectations by a few cents in most months, and, most importantly, due to revisions in fuel price expectations.
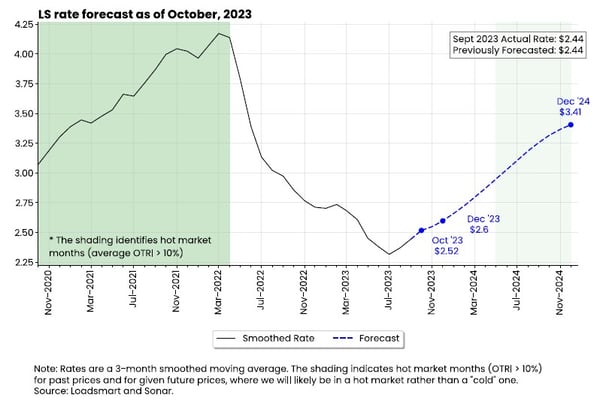
The strong correlation between our prices and Sonar’s OTRI allows us to estimate when capacity is likely to become tight (defined as OTRIs above 10%).
- In the figure below, we display the probability of being a hot market based on the carrier rate we forecast every month till the end of 2024.
- When LS rates rise above $2.9, the probability that we are in a hot market is higher than the probability that we are not in a hot market.
- Based on these estimates, we are not likely to see a hot market until April 2024.
In July, the Conference Board’s Consumer Confidence Index rose back to levels seen in early 2022 when consumption was still growing above 5% year-over-year.
The rise in the index reflects consumers’ optimism about current macroeconomic conditions (the labor market, business conditions, and household income), which might be stemming from recent positive news: inflation is easing, the labor market remains strong and the debt ceiling crisis is over.
In the current context of economic uncertainty, the rebound in consumer confidence suggests the odds of a soft landing have been raised, at least from consumers’ perspective.
Full Truckload Market Update
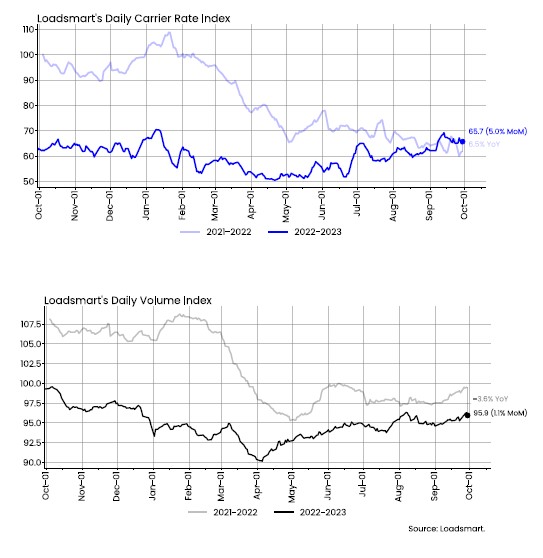
Starting this report, our indices will change. The volume index has been adjusted to reflect market fluctuations rather than internal volume shifts within our company, and with this change in the volume index, we took the opportunity to rescale our price index using a simpler scale where prices are indexed to the start date of our pricing series (October 1, 2021).
Rates: Our Price Index increased by 4.1% MoM in September. Rates were sluggish at the start due to the Labor Day holiday, but jumped after the second week of the month and continued throughout September at a new level. For the first time in the year, we had a YoY increase in the index.
Volumes: Our Volume Index rose 1.1% MoM in September, slightly outperforming Sonar’s OTVI, which was flat for the month. The index has already rebounded about 6% from its April low and we expect this trend to continue as we enter the peak season.
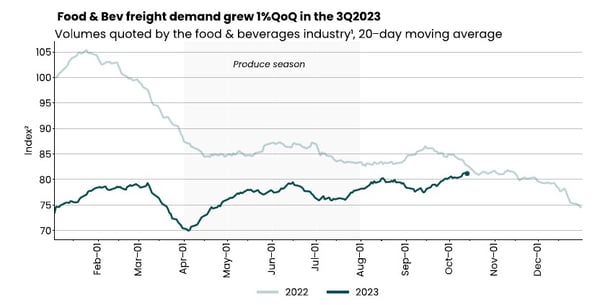
Food & Beverage Freight Demand
Since our volume index has changed, we also decided to change our industry indices so they would keep the same methodology. From now on, we will measure an industry’s quoting volume according to the quoting activity of a select group of the top 10 shippers within that industry. This helps us to ensure that large fluctuations in our indices from quarter to quarter are correlated with actual economic activity and not simply the result of new customers being added to our database.
Our quoted volumes related to the Food & Beverage sector grew 1% QoQ during the Q3 2023. The new index revealed that this sector’s volumes (figure above) and the total volumes (Figure Total Volumes) behave in a remarkably similar way, the explanation for this being that:
- A large share of our top shippers are in Food & Beverage;
- This business has been one of the hardest hit by the supply chain post-covid normalization process we have been through over the past two years - once there were no more logistical disruptions, the top shippers that make up our index began to face higher market competition, which slowed their shipped volumes through 2022 and 2023.
Want to have access to more information like what you’ve just read – and related freight data?
Download the Quarterly Freight Data Report Q3 2023 from Loadsmart. The report includes data that give perspectives and market intelligence on the following conclusions:
- Factory orders are showing strength, although it’s limited to a few sectors
- Soaring fuel prices: Was the spot rate recovery simply a pass-through of a diesel price increase to rates?
- Transportation and warehousing was the worst-performing sector in the Q1 2023 – what does this mean for food shippers?
- Seasonal hiring announcements have been mostly muted this year
- Retail freight demand was falt in Q3 2023 – why was this?
Learn more at bit.ly/shipperdata23

Like this kind of content? Subscribe to our "Food For Thought" eNewsletter!

Now more than ever, professionals consume info on the go. Distributed twice monthly, our "Food For Thought" e-newsletter allows readers to stay informed about timely and relevant industry topics and FSA news whether they're in the office or on the road. Topics range from capacity, rates and supply chain disruption to multimodal transportation strategy, leveraging technology, and talent management and retention. Learn More
