

by FTR | Thought Leadership, on Feb 26, 2026

A big week in the release of some major economic indicators was instantly overshadowed last Friday morning by the U.S. Supreme Court’s long-awaited ruling that President Trump could not impose tariffs by relying on emergency powers.
The decision cancels the country-specific tariffs imposed last year but does not affect Section 232 or Section 301 tariffs, for example. However, Trump – not surprisingly – promptly announced that he would use other authority to impose 10% tariffs globally.
In other developments, the economy’s growth in the fourth quarter was much softer than it was in the third quarter, and from a freight perspective it was weaker still as the greatest strength by far was in the services sector. One weakness was a one-time hit as the government shutdown apparently took a significant bite out of government spending.
Economic indicators were mixed. The most significant related to freight – industrial production – was positive. Consumer spending on goods was weak in December. Home building has improved but isn’t all that strong while sales of new homes are volatile. Trade volatility continues, and gold, pharmaceuticals, and computers remain the biggest drivers.
Supreme Court Ruling on Tariffs
In a 6-3 decision, the U.S. Supreme Court on Friday ruled that President Trump improperly imposed tariffs on basically all other countries last year. However, Trump promptly announced in a social media post that he would impose a 10% increase on tariffs globally using Section 122 of the Trade Act of 1974.
The Section 122 tariffs will remain in place for up to 150 days, but Congress must vote to extend them beyond that period. However, given Trump’s demonstrated willingness to push the limits of executive power, it is conceivable that even if Congress were to fail to extend the Section 122 tariffs, he might try to impose them again after they lapse, thus restarting the clock. Such a move obviously would lead to further litigation, but that does not mean it won’t happen. In any case, 10% global tariffs apparently will be in place at least through late summer.
The Supreme Court invalidated Trump’s reliance on the International Emergency Economic Powers Act (IEEPA) to impose broad tariffs on imports from countries across the globe. The court held that aside from tariff authority explicitly provided the president under the Trade Act, the authority to impose tariffs and other taxes and duties clearly was invested in Congress by the U.S. Constitution.
Two groups of tariffs were involved. The so-called “reciprocal” tariffs imposed duties of at least 15% for most nations – some, especially in Asia, were closer to 20% – and at least 10% on all others.
The other set of tariffs were the so-called “trafficking” tariffs that were imposed on Mexico, Canada, and China and were linked to immigration and trafficking in fentanyl or precursors to the drug.
The Chinese tariff had been dropped to 10% under a stop-gap trade pact a few months ago. Mexican and Chinese imports generally faced 25% tariffs, but goods complying with the U.S.-Mexico-Canada agreement were excluded.
There remain some significant issues to be resolved, including whether and how to refund the close to $200 billion in improper tariffs that were collected since early last year. That and other issues apparently will be sorted out by the U.S. Court of International Trade, which handled the initial case.
As noted above, the decision affects only the tariffs based on IEEPA. Those imposed under Section 232 or Section 301 of the Trade Act remain in place, and Trump reaffirmed in his social media post that they would continue. Some notable such tariffs are those on steel and aluminum, passenger vehicles and parts, and medium-duty and heavy-duty trucks, the latter of which were imposed in November.
Media reports had suggested that the Trump administration might pull back somewhat on the steel and aluminum tariffs, but the Supreme Court loss probably makes that outcome less likely now.
Industrial Production and Manufacturing
Although the Federal Reserve reduced recent months’ estimates slightly, January was a strong month for the manufacturing sector, according to preliminary figures. Seasonally adjusted output rose 0.6% m/m – the strongest gain since last February – to the highest level since October 2022. Manufacturing production was up 2.4% y/y, which is the largest prior-year comparison since February 2022. The growth in total industrial production (IP) was even stronger, rising 0.7% m/m as a 2.1% increase in utilities output offset a 0.2% dip in mining.
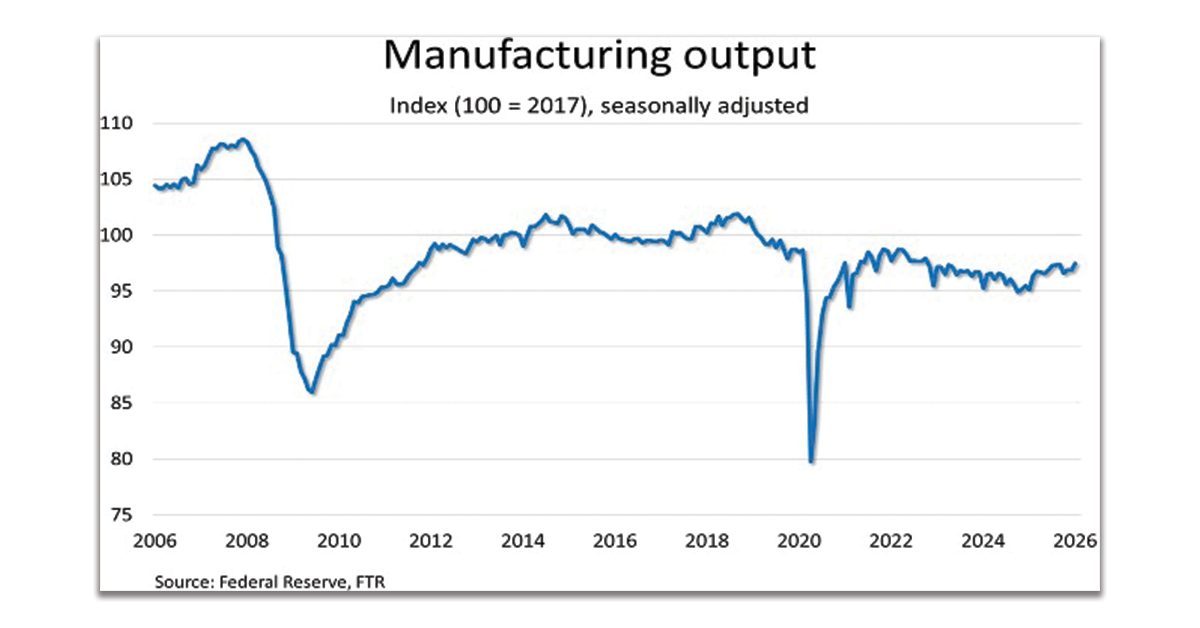
Total IP also is even stronger than manufacturing alone historically, hitting the highest level since August 2019, according to the initial data. IP was up 2.3% y/y – the strongest since September 2022.
Within manufacturing, durable goods production outpaced output for nondurable goods, rising 0.8% m/m. Nondurable goods production increased 0.4%. Within durables, nearly all component industries posted gains, including increases of 1% or more in nonmetallic mineral products, machinery, computer and electronic products, miscellaneous durable goods, and motor vehicle and parts. Automotive’s 1.3% m/m increase was the first of any size since August of last year.
An especially encouraging development was the 1.2% m/m increase in machinery production, keeping the y/y comparison at +4.1% y/y, which is the strongest since February 2022. Machinery is a particularly notable component of IP because it is a key capital good used to produce other goods.
Manufacturing Orders
Excluding the typical distortion of transportation equipment due to aircraft orders, new orders for durable manufactured goods increased 0.9% m/m, seasonally adjusted, in December, matching last September for the strongest gain since September 2024. Orders excluding transportation equipment were up 5.1% y/y – strongest since October 2022.
Due to a 25% drop in civilian aircraft orders, new orders for transportation equipment fell 5.3% m/m, dragging total new orders for durable goods down 1.4%. Total orders were up 10% y/y.
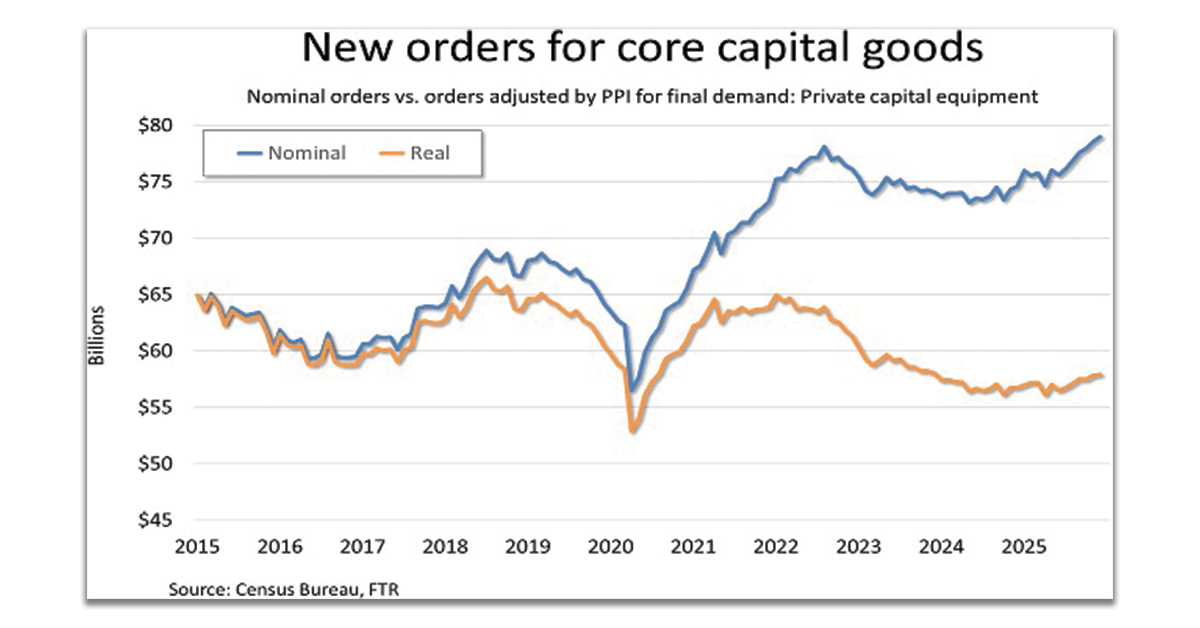
New orders for core capital goods – nondefense capital goods excluding aircraft – rose 0.6% m/m for the sixth straight increase. Orders were up 5.9% y/y, not quite as strong as October but otherwise the strongest since October 2022.
Because Census Bureau dollar-value data is not adjusted for pricing, we use the Producer Price Index for private capital equipment to calculate a “real” core capital goods order figure. Using that approach, real new orders for core capital goods ticked up 0.2% and were up 2.1% y/y.
Although real orders lag nominal orders, they have still improved significantly recently. After being down y/y from October 2022 through April 2025, real new orders for core capital goods have exceeded prior year levels in all but one month since May and have been notably stronger y/y since October.
Gross Domestic Product
The U.S. economy grew in the fourth quarter of last year largely on consumers’ spending on services, especially health care and housing & utilities. Spending on goods added nothing to economic growth overall, although a few commodities – mostly some with limited freight impact – did contribute.
A sizeable negative for the economy was government spending as a clear consequence of the 43- day government shutdown that occurred entirely within the fourth quarter.
Real Gross Domestic Product (GDP) increased 1.4% quarter over quarter (q/q) on a seasonally adjusted annualized basis. However, real consumer spending on services alone would have resulted in GDP growth of just under 1.6%, so the rest of the economy combined declined slightly.
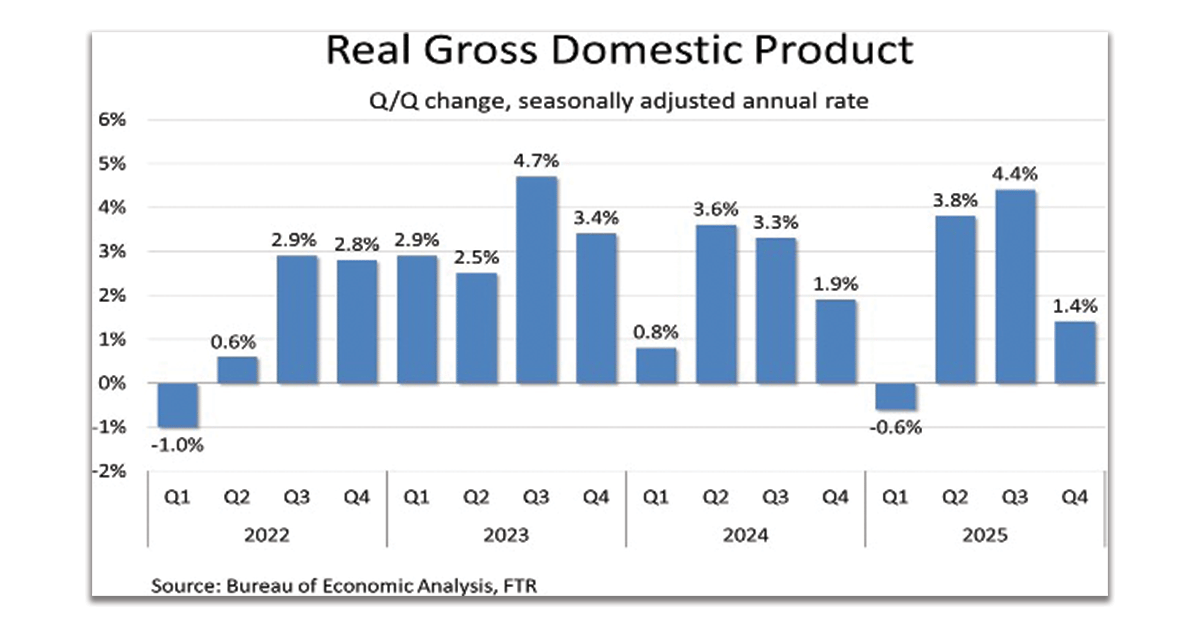
A big drop in federal government spending due to the shutdown reduced GDP growth by nearly 1.2 points. Slight growth in state and local government spending partially offset that hit, but overall government spending reduced GDP by just under 1 point.
Investment was the second largest contributor to growth, but the details indicated limited impact on freight. The improvement came in two areas – equipment and intellectual property. The latter clearly has almost no freight impact, and the equipment contribution was all from information processing equipment, which has limited impact. All other equipment categories were negative.
Net exports were slightly positive in Q4, but this, too, was a negative for freight. Both goods exports and imports declined, but because imports count as a negative in the GDP calculation, that weakness bolstered GDP. However, the increased imports presumably were a major factor in the increase in private inventories, which was a positive.
Obviously, the 1.4% annualized growth did little to support freight. In fact, the portion of the economy linked to freight transportation – what FTR calls the GDP Goods Transport Sector – declined 0.5% annualized in Q4 after ticking up 0.4% in Q3.
Consumer Spending
Adjusted for inflation, consumer spending barely changed in December, ticking up just 0.1% m/m, seasonally adjusted. That miniscule growth came entirely from real spending on services, which was up 0.3%.
Real spending on goods eased 0.5% as spending on durable goods fell 0.9% and spending on nondurable goods declined 0.3%. The biggest hit for durable goods was in vehicles and parts.
The November data had revealed a worry about the durability of consumer spending as it indicated that the personal saving rate had been falling steadily. The latest data still shows a downward trend in the saving rate since May of last year. In December, the saving rate was 3.6%, which is the lowest level since October 2022.
Whether the dwindling resources implied by a falling saving rate will affect consumption is an open question, and a big wild card is tax season. Changes in last year’s budget reconciliation tax act are widely expected to boost tax refunds this spring.
Although tax filings are not due until mid-April, refunds presumably have already started to flow as many filers expecting healthy refunds surely have filed already. The largest disbursements, though, likely will be in April and May.
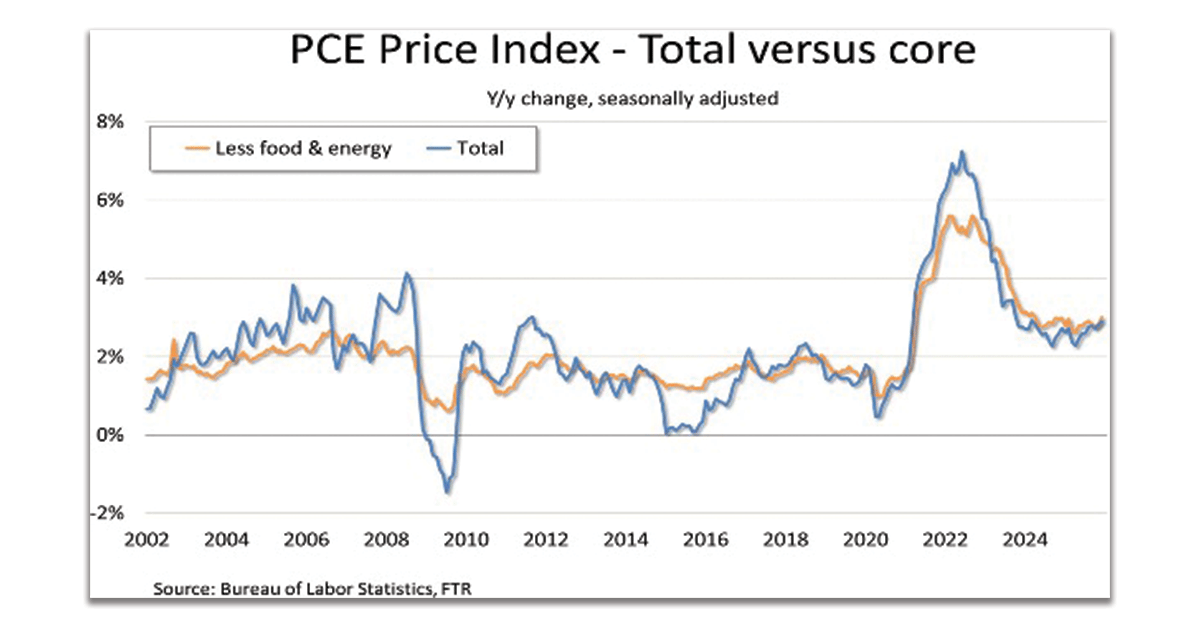
Another issue is buying power, and the December data was not encouraging. The personal consumption expenditures (PCE) price index moved higher y/y overall and excluding food & energy. Consumer Price Index data, which has been released through January, is stable, but it is notable that the Federal Reserve traditionally has focused more on the PCE price index when assessing inflation.
Residential Construction
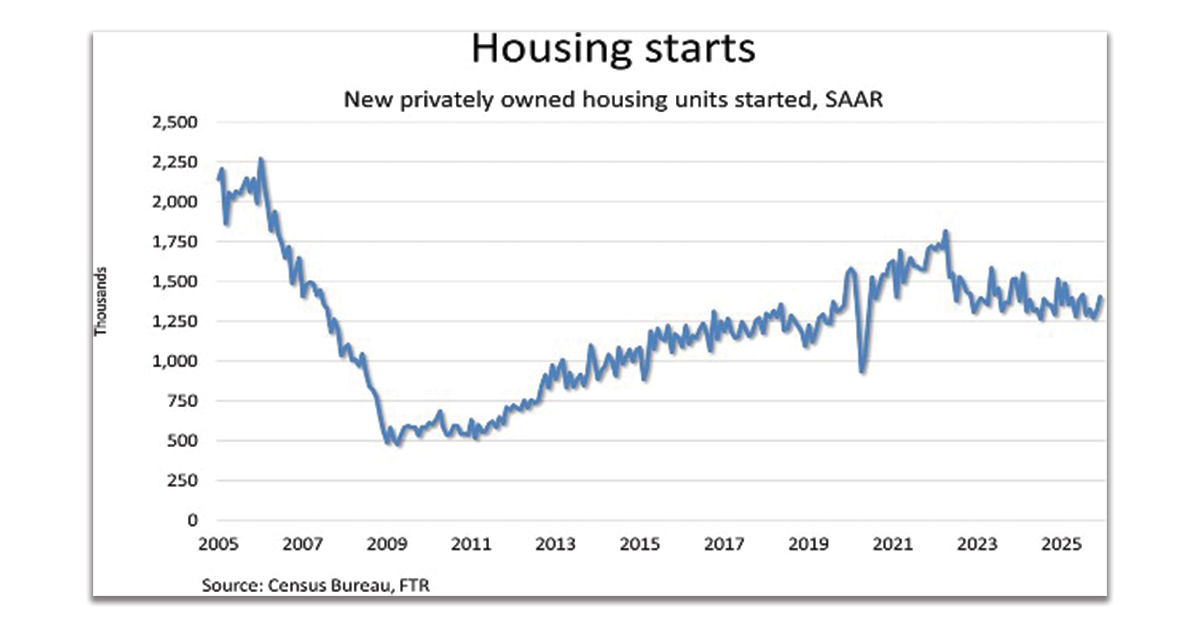
Housing starts increased m/m in November and December but were down y/y in December by the most since November 2024. Starts rose 6.2% m/m in December after rising 3.9% in November. The Census Bureau released figures for November and December together as that data had been delayed by the federal government shutdown last fall.
Although down 7.3% y/y, the preliminary annualized rate of just over 1.4 million starts in December was the highest since July and stronger than the level during most months in 2024 and 2025.
Starts for both single-family homes and homes in multi-family dwellings of five or more units rose m/m in both November and December. Single-family starts were down 9% y/y while multi-family starts were down 1%. However, aside from December and October, multi-family starts have been running quite strongly y/y since March.
Permits authorized for future construction increased 4.3% m/m but were down 2.2% y/y. The difference between single-family and multi-family permits was large. Over November and December, single-family permits barely changed and were down just under 11%. Multi-family permits, however rose 18.1% in December after dropping 8.8% in November and were up 18.7% y/y in December.
U.S. International Trade in Goods
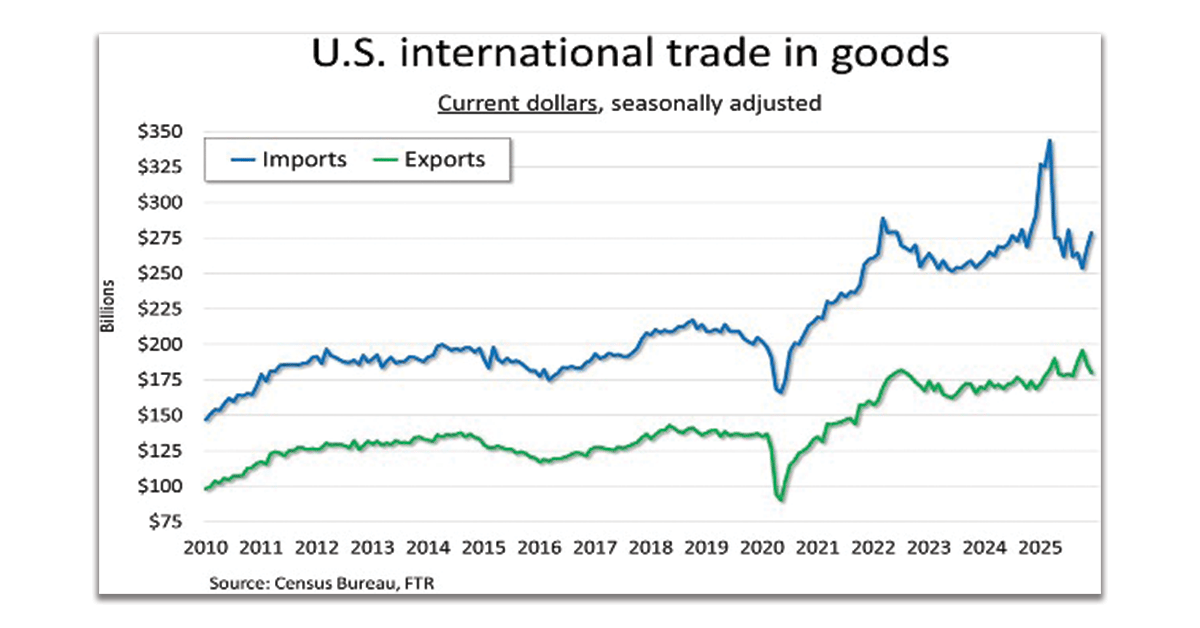
Both imports and exports of industrial supplies weighed heavily into the overall goods trade performance in December. Exports fell 3.0% m/m, including a 12.3% drop in industrial supplies. Imports rose 3.8%, including a 15.9% increase in industrial supplies. Capital goods also were strong for both as imports rose 5.5% and exports increased 4.2%.
Nonmonetary gold was overwhelmingly responsible for the drop in industrial supplies exports, but the import situation for that commodity group was somewhat more complicated. Gold was a notable factor but so were copper and crude oil.
Computers and related products were the main driver of capital goods exports, but another strength was civilian aircraft. Imports of computers declined but imports of computer accessories, telecommunications equipment, and semiconductors more than offset that weakness.
Pharmaceuticals were a big driver of both the 8.4% increase in consumer goods exports and the 5.9% drop in consumer goods imports.
Diesel Prices
The national average retail price of on-highway diesel increased 2.3 cents to $3.711 a gallon during the week ended February 16. The average price has risen about 25 cents in five weeks after falling about 41 cents in eight weeks. Prices were up in all regions except for New England where prices declined about 2 cents.
Presumably due to rising tensions with Iran, crude prices have risen modestly recently. On February 19, West Texas Intermediate closed at $66.43 a barrel, which is the highest closing price since August 1. WTI was trading at around that price on Friday.
Related Articles:
- Economy Factors: Closing In On An Inflection
- An All-American Driver Workforce?
- FLASH REPORT: A Taxing Time for the U.S. Economy
- West Coast Ports Are Gaining Share – Is This Reversion Here to Stay?
- Market Impact: Heavy-Duty Truck Tariffs
Like this kind of content? Subscribe to our "Food For Thought" eNewsletter!

Now more than ever, professionals consume info on the go. Distributed twice monthly, our "Food For Thought" e-newsletter allows readers to stay informed about timely and relevant industry topics and FSA news whether they're in the office or on the road. Topics range from capacity, rates and supply chain disruption to multimodal transportation strategy, leveraging technology, and talent management and retention. Learn More
