

by Courtney Bloom, on Nov 03, 2025
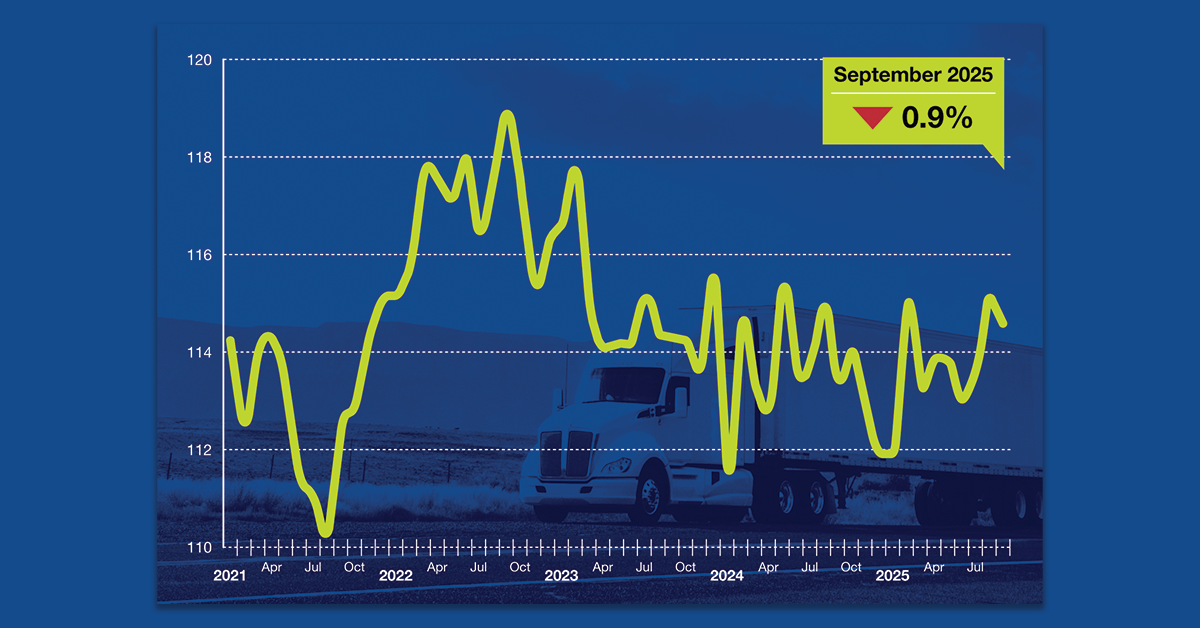
Trucking activity in the United States decreased in September, pushing the level down to the lowest in three months. Specifically, truck freight tonnage declined 0.9% after gaining 0.9% in August and 1.1% in July, according to the American Trucking Associations’ advanced seasonally adjusted For-Hire Truck Tonnage Index.
 “Tonnage levels remain choppy, but they are up 2.1% since hitting a low in January,” says ATA Chief Economist Bob Costello, one of the most respected authorities on the freight economy who regularly speaks at the annual Food Shippers conference. “Compared to the high three years earlier, however, truck tonnage is still off by 3.9%. In fact, September’s tonnage level was essentially the same as in September 2023, underscoring the tough freight market over the last few years.”
In September, the ATA advanced seasonally adjusted For-Hire Truck Tonnage Index equaled 114.2, down from 115.3 in August. The index, which is based on 2015 as 100, rose 0.8% from the same month last year after increasing 0.4% in August. Year-to-date, compared with the same period in 2024, tonnage was up 0.2%.
August’s SA increase was unchanged from that first reported in our September 23 press release.
The not seasonally adjusted index, which calculates raw changes in tonnage hauled, equaled 114.7 in September, 2.6% below August’s reading of 117.7.
Trucking serves as a barometer of the U.S. economy, representing 72.7% of tonnage carried by all modes of domestic freight transportation, including manufactured and retail goods. Trucks hauled 11.27 billion tons of freight in 2024.* Motor carriers collected $906 billion, or 76.9% of total revenue earned by all transport modes.
Both indices are dominated by contract freight, as opposed to traditional spot market freight. The tonnage index is calculated on surveys from its membership and has been doing so since the 1970s. This is a preliminary figure and subject to change in the final report issued around the 5th day of each month. The report includes month-to-month and year-over-year results, relevant economic comparisons, and key financial indicators.
Related Articles:
- Truck Tonnage Rose 0.9% in August
- Truck Tonnage Rose 0.6% in July
- Truck Tonnage Declined 0.4% in June
- Truck Tonnage Declined 0.1% in May
- Truck Tonnage Declined 0.3% in April 2025
- Truck Tonnage Declined 1.5% in March 2025
Like this kind of content? Subscribe to our "Food For Thought" eNewsletter!

Now more than ever, professionals consume info on the go. Distributed twice monthly, our "Food For Thought" e-newsletter allows readers to stay informed about timely and relevant industry topics and FSA news whether they're in the office or on the road. Topics range from capacity, rates and supply chain disruption to multimodal transportation strategy, leveraging technology, and talent management and retention. Learn More
