

by Staff, on Dec 22, 2022
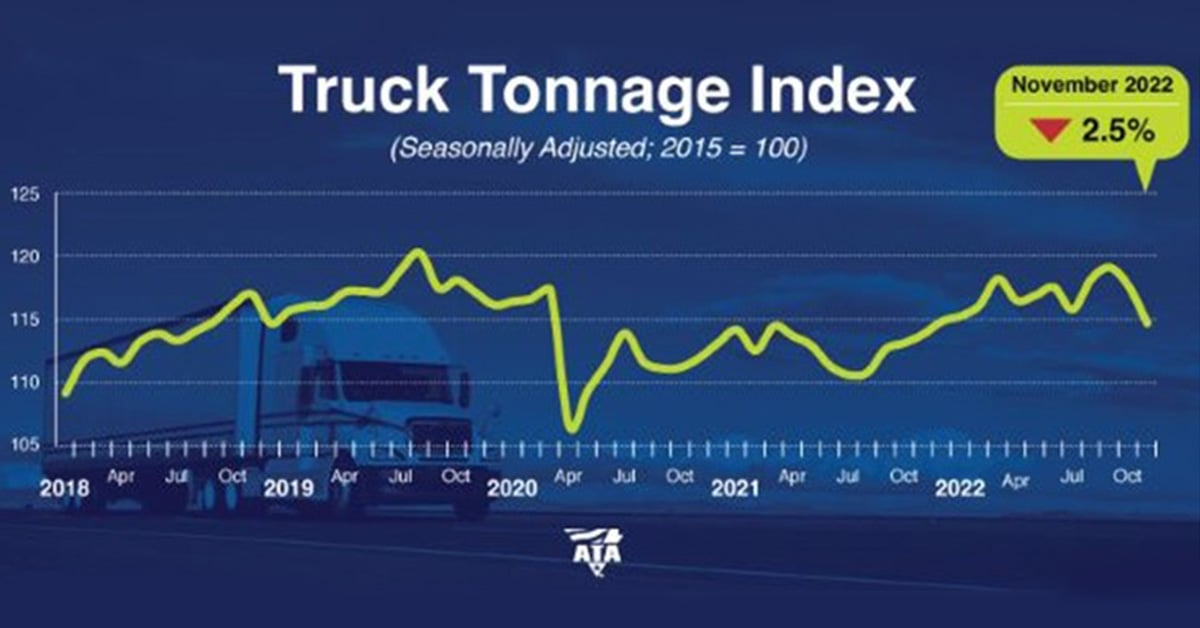
American Trucking Associations’ advanced seasonally adjusted (SA) For-Hire Truck Tonnage Index decreased approximately 2.5% in November after an additional slip in October. In November, the index equaled 114.7 (2015=100) versus 117.6 in October.
“For-hire truck tonnage saw the largest single monthly decrease in November since the start of the pandemic and a total drop of 3.7% in October and November,” said ATA Chief Economist Bob Costello, who regularly speaks at FSA’s annual conference and is considered one of FSA’s most respected guest authorities on the trucking marketplace. “The decreases match anecdotal reports of a soft fall freight season as well as a slowing goods-economy generally. Housing-related freight is particularly weak.”
View news release: ATA Truck Tonnage Index Slipped 2.3% in October.
Compared with November 2021, the SA index increased 0.8%, which was the fifteenth straight year-over-year gain, but the smallest over that period. In October, the index was up 4% from a year earlier. Year-to-date through November, compared with the same period in 2021, tonnage was up 3.7%.
The not seasonally adjusted index, which represents the change in tonnage actually hauled by fleets before any seasonal adjustment, equaled 114.6 in November, 4.6% below the October level (120.2). In calculating the index, 100 represents 2015. ATA’s For-Hire Truck Tonnage Index is dominated by contract freight as opposed to spot market freight.
Trucking serves as a barometer of the U.S. economy, representing 72.2% of tonnage carried by all modes of domestic freight transportation, including food, beverage, manufactured and retail goods. Trucks hauled 10.93 billion tons of freight in 2021, and a significant portion of this involves food and beverages. Motor carriers collected $875.5 billion, or 80.8% of total revenue earned by all transport modes.
ATA calculates the tonnage index based on surveys from its membership and has been doing so since the 1970s. This is a preliminary figure and subject to change in the final report issued around the 5th day of each month. The report includes month-to-month and year-over-year results, relevant economic comparisons, and key financial indicators.
Like this kind of content? Subscribe to our "Food For Thought" eNewsletter!

Now more than ever, professionals consume info on the go. Distributed twice monthly, our "Food For Thought" e-newsletter allows readers to stay informed about timely and relevant industry topics and FSA news whether they're in the office or on the road. Topics range from capacity, rates and supply chain disruption to multimodal transportation strategy, leveraging technology, and talent management and retention. Learn More
