

by Courtney Bloom, on Feb 21, 2024
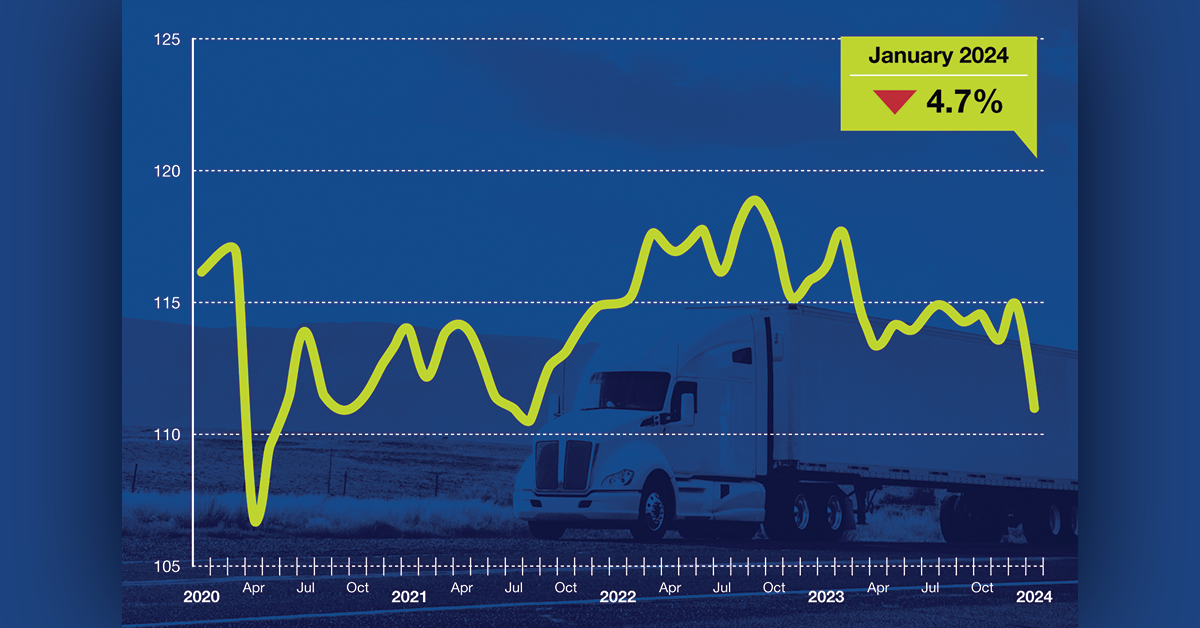
American Trucking Associations’ advanced seasonally adjusted For-Hire Truck Tonnage Index decreased 3.5% in January after increasing 1.2% in December. In January, the index equaled 111.0 (2015=100) compared with 115.0 in December.
ATA recently revised the seasonally adjusted index back five years as part of its annual revision. “January’s data was a snap back to reality for anyone thinking the freight market was about to turn the corner,” says ATA Chief Economist Bob Costello, one of the most respected authorities on the freight economy who regularly speaks at the annual Food Shippers conference. “Bad winter weather in January likely hurt volumes, not to mention sharp drops in a number of drivers of tonnage including retail sales, housing starts and manufacturing output.”
December’s increase was revised down from their January 23 press release.
Compared with January 2023, the SA index fell 4.7%, which was the eleventh straight year-over-year decrease. In December, the index was down 0.8% from a year earlier.
The not seasonally adjusted index, which represents the change in tonnage actually hauled by the fleets before any seasonal adjustment, equaled 109.4 in January, 0.7% below December’s level (110.2). In calculating the index, 100 represents 2015. ATA’s For-Hire Truck Tonnage Index is dominated by contract freight as opposed to spot market freight.
Trucking serves as a barometer of the U.S. economy, representing 72.6% of tonnage carried by all modes of domestic freight transportation, including manufactured and retail goods. Trucks hauled 11.46 billion tons of freight in 2022. Motor carriers collected $940.8 billion, or 80.7% of total revenue earned by all transport modes.
ATA calculates the tonnage index based on surveys from its membership and has been doing so since the 1970s. This is a preliminary figure and subject to change in the final report issued around the 5th day of each month. The report includes month-to-month and year-over-year results, relevant economic comparisons, and key financial indicators.
Related Articles:
- Truck Tonnage Index Increased 2.1% in December
- Truck Tonnage Index Decreased 1% in November
- Truck Tonnage Increases 1.1% in October 2023
- Truck Tonnage Index Falls 1.1% in September 2023
- Truck Tonnage Index Rose .2% in August 2023
- Truck Tonnage Index Decreases .8% in July 2023
- Truck Tonnage Index Increases 2.1% in June 2023
- Truck Tonnage Index Increases 2.4% in May 2023
- Truck Tonnage Index Decreases 1.7% in April 2023
- Truck Tonnage Decreases 5.4% in March 2023
- Truck Tonnage Increases 1.2% in February 2023
Like this kind of content? Subscribe to our "Food For Thought" eNewsletter!

Now more than ever, professionals consume info on the go. Distributed twice monthly, our "Food For Thought" e-newsletter allows readers to stay informed about timely and relevant industry topics and FSA news whether they're in the office or on the road. Topics range from capacity, rates and supply chain disruption to multimodal transportation strategy, leveraging technology, and talent management and retention. Learn More
